
June 25, 2026 a 03:15 pm
TMO: Fibonacci Analysis - Thermo Fisher Scientific Inc.
Thermo Fisher Scientific Inc. continues to be a dominant player in the scientific services sector, leveraging its expansive portfolio to maintain market strength. Despite recent fluctuations, the company's strategic expansions and strong fundamentals suggest potential resilience. Investors should watch for market conditions that may trigger significant price movements, with technical indicators currently showing mixed signals.
Fibonacci Analysis
| Parameter | Details |
|---|---|
| Trend Period | 2026-01-26 to 2026-06-25 |
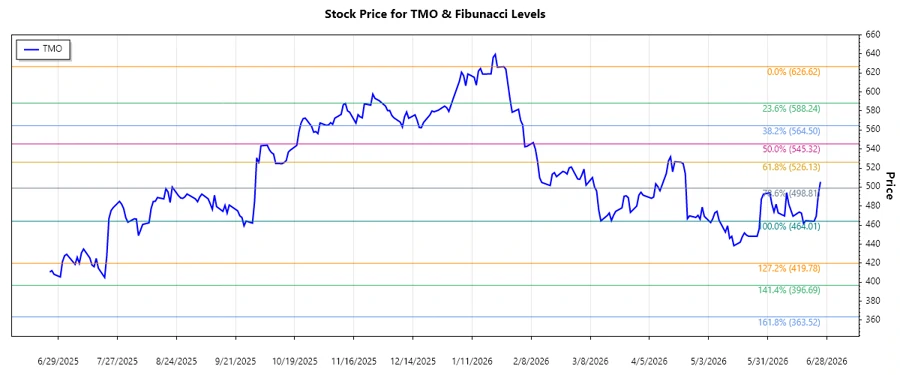
| High Point | 626.62 (2026-01-26) |
| Low Point | 464.01 (2026-06-22) |
| Fibonacci Levels |
|
| Current Retracement Zone | 0.236 |
| Technical Interpretation | The current price appears to be testing the 0.236 retracement level, potentially indicating a minor resistance if unable to break above it. |
Conclusion
Thermo Fisher Scientific Inc.'s recent downtrend suggests cautious optimism might be warranted. While the stock shows resilience and the potential for recovery, current technical levels hint at interim resistances that could slow progress. Analysts should monitor the stock for potential breakouts beyond the 0.236 Fibonacci level, which might indicate a reversal into bullish territory. However, should prices retract further into lower Fibonacci zones, bearish continuation could be a risk. The company's broad sector reach and robust service offerings present long-term growth opportunities but remain susceptible to market volatility.
Smart Data Insight
Master the Perfect Entry & Exit for this Stock
Don't leave your profits to chance. Historically, this stock follows specific seasonal patterns that institutional traders use to maximize returns.
- ✅ Identify the "Golden Buying Window"
- ✅ Avoid high-risk correction cycles
- ✅ Backtested data from the last 20+ years