October 14, 2025 a 03:15 pm

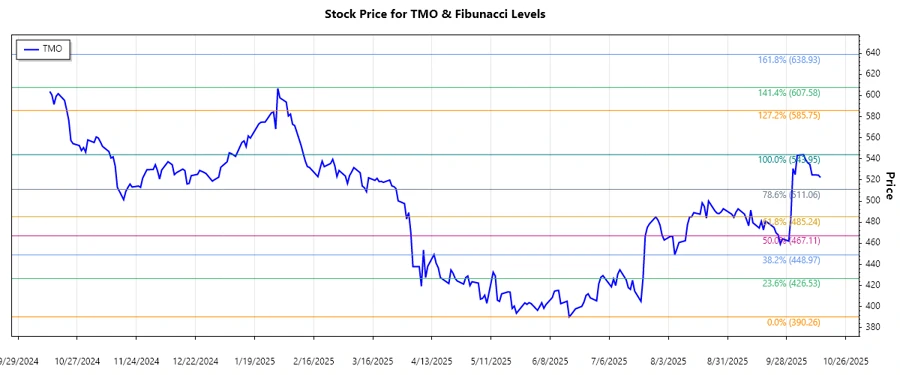
TMO: Fibonacci Analysis - Thermo Fisher Scientific Inc.
Thermo Fisher Scientific Inc., renowned for its comprehensive services and products in life sciences and diagnostics, is a major player in the biotechnology sector. Recently, the stock has experienced a noticeable upward trend, suggesting positive investor sentiment. However, like other stocks in the sector, it remains susceptible to broad market dynamics and sector-specific innovations.
Fibonacci Analysis
The analysis covers a notable upward trend observed over recent months, characterized by the stock's movement from a low of $390.26 on June 17, 2025, to a high of $543.95 on October 6, 2025.
| Start Date | End Date | High (Date) | High (Price) | Low (Date) | Low (Price) |
|---|---|---|---|---|---|
| 2025-06-17 | 2025-10-06 | 2025-10-06 | $543.95 | 2025-06-17 | $390.26 |
| Level | Price Level |
|---|---|
| 0.236 | $462.71 |
| 0.382 | $494.36 |
| 0.5 | $517.11 |
| 0.618 | $539.86 |
| 0.786 | $563.55 |
The current stock price of $522.36 on October 14, 2025, places it near the 0.5 Fibonacci retracement level, indicating a potential area of support.
This level could offer a strong support area, making it a critical point to monitor for potential reversals or further continuation of the upward trend.
Conclusion
Analyzing Thermo Fisher Scientific's recent price increases highlights promising prospects, supported by robust demand for life sciences and analytical products. The stock price's interaction with the 0.5 retracement level suggests potential support, indicating a favorable opportunity for bullish investors if the stock holds above this level. However, the general market conditions and sector trends are critical, as unexpected macroeconomic events could influence volatility. Navigating this landscape requires careful watch on market indicators, balancing the opportunities and risks inherent in investing in dynamic growth sectors like biotechnology.
Smart Data Insight
Master the Perfect Entry & Exit for this Stock
Don't leave your profits to chance. Historically, this stock follows specific seasonal patterns that institutional traders use to maximize returns.
- ✅ Identify the "Golden Buying Window"
- ✅ Avoid high-risk correction cycles
- ✅ Backtested data from the last 20+ years