
July 11, 2026 a 03:31 pm
TMO: Dividend Analysis - Thermo Fisher Scientific Inc.
Thermo Fisher Scientific Inc., a key player in the healthcare sector, exhibits a modest dividend yield with consistent dividend history. The company maintains a strong financial footing, evident from its moderate payout ratios and robust cash flow metrics, making it an appealing option for dividend-focused investors.
📊 Overview
Thermo Fisher Scientific Inc. operates within the healthcare sector, offering a dividend yield of 0.35%. With a current dividend of $1.69 per share and a commendable 16-year dividend history, the company's consistent performance in sustaining dividends is noteworthy. There has been no recent cut or suspension.
| Metric | Detail |
|---|---|
| Sector | Healthcare |
| Dividend Yield | 0.35% |
| Current Dividend per Share | $1.69 USD |
| Dividend History | 16 years |
| Last Cut or Suspension | None |
⚠️ Dividend History
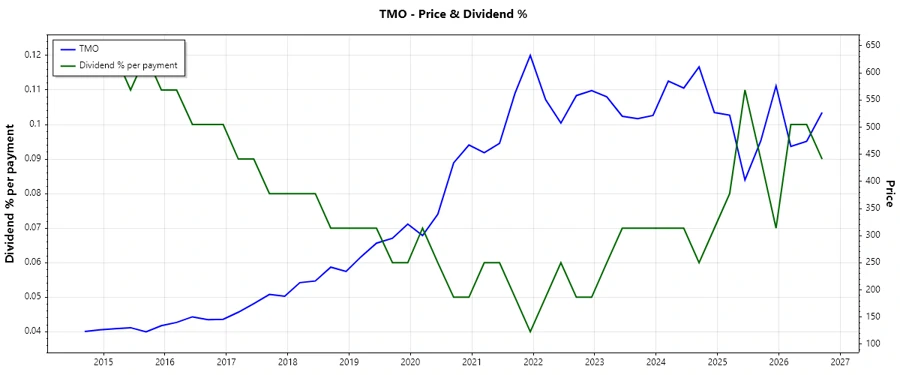
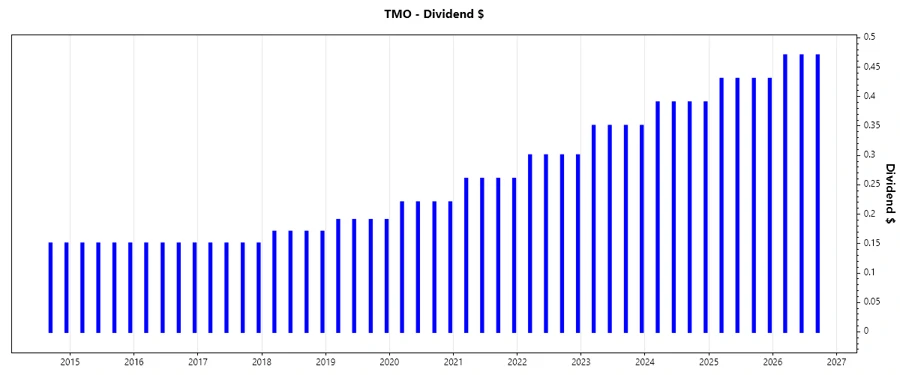
The company’s dividend history showcases stability and a commitment to returning value to shareholders. This consistency is a crucial metric, signaling reliability in dividend payments.
| Year | Dividend per Share (USD) |
|---|---|
| 2026 | $1.41 |
| 2025 | $1.72 |
| 2024 | $1.56 |
| 2023 | $1.40 |
| 2022 | $1.20 |
📈 Dividend Growth
Thermo Fisher shows a solid dividend growth rate of 12.75% over the last 3 years and 14.34% over the last 5 years, indicating a steady increase in dividend payments and reinforcing confidence in the company’s long-term fiscal health.
| Time Period | Growth |
|---|---|
| 3 years | 12.75% |
| 5 years | 14.34% |
The average dividend growth is 14.34% over 5 years. This shows moderate but steady dividend growth.
✅ Payout Ratio
The payout ratios are pivotal for assessing sustainability; with an EPS-based payout ratio of 9.17% and an FCF-based payout ratio of 9.32%, Thermo Fisher demonstrates conservative management of its earnings and cash flow, strengthening its dividend reliability.
| Payout Ratio | Percentage |
|---|---|
| EPS-based | 9.17% |
| Free cash flow-based | 9.32% |
📊 Cashflow & Capital Efficiency
Analyzing cash flow and capital efficiency is critical for understanding Thermo Fisher's capability to support operations and dividends. The company has maintained a strong free cash flow yield and a balanced operating cash flow structure, indicating effective capital allocation.
| Metric | 2023 | 2024 | 2025 |
|---|---|---|---|
| Free Cash Flow Yield | 3.38% | 3.66% | 2.89% |
| Earnings Yield | 2.93% | 3.19% | 3.09% |
| CAPEX to Operating Cash Flow | 17.59% | 16.15% | 19.51% |
| Stock-based Compensation to Revenue | 0.65% | 0.70% | 0.69% |
| Free Cash Flow / Operating Cash Flow Ratio | 80.49% | 83.85% | 80.49% |
🗣️ Balance Sheet & Leverage Analysis
Thermo Fisher maintains a resilient balance sheet with a manageable debt leverage. Their debt metrics, such as Debt-to-Equity and Debt-to-Capital ratios, suggest prudent financial management, enhancing financial stability.
| Metric | 2023 | 2024 | 2025 |
|---|---|---|---|
| Debt-to-Equity | 0.78 | 0.66 | 0.76 |
| Debt-to-Assets | 0.37 | 0.34 | 0.37 |
| Debt-to-Capital | 0.44 | 0.40 | 0.43 |
| Net Debt to EBITDA | 2.53 | 2.44 | 2.70 |
📈 Fundamental Strength & Profitability
Thermo Fisher's ability to generate high returns on equity and assets underscores its operational efficiency. Its profitability margins show an upward trend, demonstrating effective cost management and revenue generation strategies.
| Metric | 2023 | 2024 | 2025 |
|---|---|---|---|
| Return on Equity | 12.83% | 12.78% | 12.61% |
| Return on Assets | 6.07% | 6.51% | 6.11% |
| Net Margin | 13.99% | 14.77% | 15.12% |
📉 Price Development
🔍 Dividend Scoring System
This scoring system evaluates key dividend criteria on a scale of 1 to 5.
| Criteria | Score | Score Bar |
|---|---|---|
| Dividend yield | 2 | |
| Dividend Stability | 5 | |
| Dividend growth | 4 | |
| Payout ratio | 5 | |
| Financial stability | 4 | |
| Dividend continuity | 5 | |
| Cashflow Coverage | 3 | |
| Balance Sheet Quality | 4 |
Total Score: 32/40
🗣️ Rating
Thermo Fisher Scientific Inc. presents a compelling dividend profile, characterized by consistent stability, modest growth, and sound financial management. However, its relatively low dividend yield might not cater to yield-focused investors. Overall, it is a robust candidate for investors emphasizing sustainable growth and capital preservation.
Smart Data Insight
Master the Perfect Entry & Exit for this Stock
Don't leave your profits to chance. Historically, this stock follows specific seasonal patterns that institutional traders use to maximize returns.
- ✅ Identify the "Golden Buying Window"
- ✅ Avoid high-risk correction cycles
- ✅ Backtested data from the last 20+ years