March 07, 2026 a 03:31 pm


TMO: Dividend Analysis - Thermo Fisher Scientific Inc.
Thermo Fisher Scientific Inc., renowned for its market-leading innovations in life sciences, presents an appealing yet conservative dividend profile. The company's consistent dividend history spans 18 years, with a gradual trend of dividend growth reflecting a prudent financial strategy. Despite a modest current yield of 0.35%, the stable payout ratio indicates a reliable income stream for investors.
📊 Overview
Thermo Fisher operates within the Healthcare sector, maintaining a diversified portfolio that enhances its sustainable dividend payments. The firm's dividend yield, albeit modest at 0.35%, is complemented by a robust dividend history spanning 18 years without significant cuts or suspensions. This reliability underscores the company's commitment to delivering shareholder value through consistent returns.
| Metric | Value |
|---|---|
| Sector | Healthcare |
| Dividend yield | 0.35% |
| Current dividend per share | 1.69 USD |
| Dividend history | 18 years |
| Last cut or suspension | None |
🗣️ Dividend History
The dividend history reveals Thermo Fisher's strategic gradual escalation in payouts, ensuring investor confidence and showcasing financial health. The graph below highlights these steady increments, further emphasizing the company's capacity to increase shareholder returns sustainably.
| Year | Dividend per Share (USD) |
|---|---|
| 2026 | 0.47 |
| 2025 | 1.72 |
| 2024 | 1.56 |
| 2023 | 1.40 |
| 2022 | 1.20 |
📈 Dividend Growth
The dividend growth metrics underscore Thermo Fisher's steady commitment towards enhancing shareholder value, achieving an average increase of 14.34% over five years. This reflects a solid policy, balancing reinvestment with distribution, a significant indicator of future potential growth.
| Time | Growth |
|---|---|
| 3 years | 12.75% |
| 5 years | 14.34% |
The average dividend growth is 14.34% over 5 years. This shows moderate but steady dividend growth.
⚖️ Payout Ratio
Thermo Fisher's payout ratios further reinforce its financial stability, with an EPS-based payout of 9.47% and FCF-based payout of 9.99%. Such low payout ratios suggest ample room for dividend growth while maintaining cash reserves for strategic investments.
| Key figure | Ratio |
|---|---|
| EPS-based | 9.47% |
| Free cash flow-based | 9.99% |
The payout ratios indicate a conservative approach, which bodes well for future dividend sustainability and growth potential.
💸 Cashflow & Capital Efficiency
Evaluating cash flow metrics provides insight into Thermo Fisher’s financial robustness. The free cash flow yield stands at 3.37%, highlighting income potential from cash generation. The capital efficiency metrics, such as CAPEX to Operating Cash Flow at 19.51% and a healthy ratio of Free Cash Flow to Operating Cash Flow, ensure capital deployment will continue to drive growth.
| Metric | 2025 | 2024 | 2023 |
|---|---|---|---|
| Free Cash Flow Yield | 2.89% | 3.66% | 3.38% |
| Earnings Yield | 3.09% | 3.19% | 2.93% |
| CAPEX to Oper. Cash Flow | 19.51% | 16.15% | 17.59% |
| Stock-based Compensation to Revenue | 0% | 0.70% | 0.65% |
| Free Cash Flow / Operating Cash Flow Ratio | 80.49% | 83.85% | 82.41% |
Thermo Fisher’s cash flow metrics signify a solid financial foundation conducive to long-term growth and capital efficiency.
📊 Balance Sheet & Leverage Analysis
A review of the balance sheet and leverage ratios reveals a well-managed debt structure, with a debt-to-equity ratio of 0.76 in 2025, showing a prudent balance between equity and debt financing. Net debt to EBITDA indicates sound managerial control over leverage at 2.70.
| Metric | 2025 | 2024 | 2023 |
|---|---|---|---|
| Debt-to-Equity | 0.76 | 0.66 | 0.78 |
| Debt-to-Assets | 0.37 | 0.34 | 0.37 |
| Debt-to-Capital | 0.43 | 0.40 | 0.44 |
| Net Debt to EBITDA | 2.70 | 2.44 | 2.53 |
| Current Ratio | 1.89 | 1.66 | 1.75 |
| Quick Ratio | 1.53 | 1.29 | 1.39 |
| Financial Leverage | 2.07 | 1.96 | 2.11 |
The balance sheet analysis indicates a strong financial structure, ensuring liquidity and manageable leverage levels that support operational flexibility.
📈 Fundamental Strength & Profitability
The fundamental strength of Thermo Fisher is highlighted by its robust profitability metrics, with a steady return on equity and margin improvements over recent years. The 2025 figures reflect a return on equity of 12.61% and a net profit margin of 15.12%.
| Metric | 2025 | 2024 | 2023 |
|---|---|---|---|
| Return on Equity | 12.61% | 12.78% | 12.83% |
| Return on Assets | 6.11% | 6.51% | 6.07% |
| Gross Margin | 37.66% | 41.34% | 40.12% |
| EBIT Margin | 19.49% | 20.27% | 18.17% |
| EBITDA Margin | 25.73% | 27.52% | 26.12% |
| R&D to Revenue | 3.14% | 3.24% | 3.12% |
The profitability indicators confirm Thermo Fisher's efficiency in operations and the potential for continued robust performance.
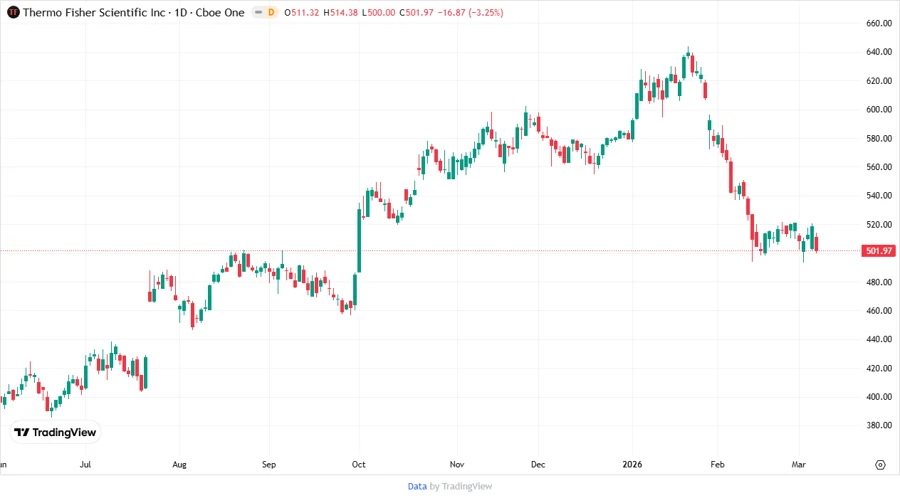
🔍 Price Development
✅ Dividend Scoring System
| Criteria | Score (1-5) | |
|---|---|---|
| Dividend yield | 3 | |
| Dividend Stability | 5 | |
| Dividend growth | 4 | |
| Payout ratio | 5 | |
| Financial stability | 4 | |
| Dividend continuity | 5 | |
| Cashflow Coverage | 4 | |
| Balance Sheet Quality | 4 |
Total Score: 34/40
🗒️ Rating
Thermo Fisher Scientific Inc. presents a solid investment case with its reliable dividend policy and strong growth prospects. Although the yield remains on the lower spectrum, the firm's financial stability and strategic reinvestment capabilities offer potential for capital appreciation. The current dividend policy, coupled with a robust financial structure, makes it a prudent choice for investors seeking stable returns alongside growth opportunities.