February 14, 2026 a 11:31 am
TMO: Dividend Analysis - Thermo Fisher Scientific Inc.
Thermo Fisher Scientific Inc. presents a modest dividend yield profile with strategic growth efforts over the past decades. Despite a relatively low dividend yield, the company's commitment to steady dividend increases makes it an appealing prospect for long-term dividend growth investors. The solid dividend history and efficient capital management emphasize its stability and growth potential.
📊 Overview
Thermo Fisher Scientific Inc. operates within the Health Care sector, offering a compelling investment with a dividend history extending over 17 years. With a current dividend yield of 0.30% and a dividend per share of 1.69 USD, the company maintains a robust growth trajectory despite a last cut or suspension dating back to 2012.
| Metric | Value |
|---|---|
| Sector | Health Care |
| Dividend yield | 0.30% |
| Current dividend per share | 1.69 USD |
| Dividend history | 17 years |
| Last cut or suspension | 2012 |
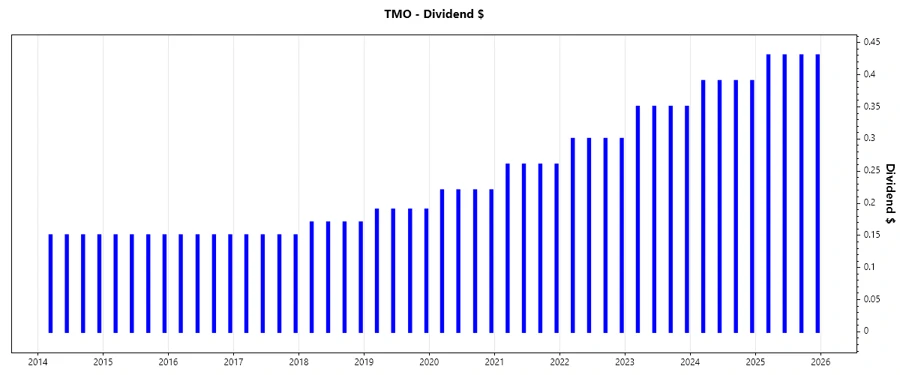
📈 Dividend History
With a consistent dividend payment record, Thermo Fisher Scientific illustrates remarkable reliability. Historically stable, its past dividend policies enhance the confidence of income-focused investors.
| Year | Dividend per Share (USD) |
|---|---|
| 2025 | 1.72 |
| 2024 | 1.56 |
| 2023 | 1.40 |
| 2022 | 1.20 |
| 2021 | 1.04 |
📈 Dividend Growth
Thermo Fisher Scientific demonstrates a dividend growth rate of 12.75% over the past 3 years and 14.34% over the past 5 years. This indicates a strong trajectory of dividend increase, reinforcing its attractiveness to growth-oriented investors.
| Time | Growth |
|---|---|
| 3 years | 12.75% |
| 5 years | 14.34% |
The average dividend growth is 14.34% over 5 years. This shows moderate but steady dividend growth.
💰 Payout Ratio
The payout ratio is a critical indicator of dividend sustainability. Thermo Fisher Scientific maintains prudent payout ratios based on both EPS and free cash flow, signifying a well-managed dividend policy.
| Key figure | Ratio |
|---|---|
| EPS-based | 9.47% |
| Free cash flow-based | 10.10% |
The EPS payout ratio of 9.47% and FCF payout ratio of 10.10% indicate a conservative dividend strategy, allowing for substantial reinvestment potential.
💸 Cashflow & Capital Efficiency
Analyzing cash flow and capital efficiency metrics is crucial for understanding the company's operational health. Thermo Fisher's positive free cash flow yield and prudent CAPEX management reflect a strong financial foundation.
| Metric | 2025 | 2024 | 2023 |
|---|---|---|---|
| Free Cash Flow Yield | 2.89% | 3.66% | 3.38% |
| Earnings Yield | 3.09% | 3.19% | 2.93% |
| CAPEX to Operating Cash Flow | 19.51% | 16.15% | 17.59% |
| Stock-based Compensation to Revenue | 0% | 0.70% | 0.65% |
| Free Cash Flow / Operating Cash Flow Ratio | 80.49% | 83.85% | 82.41% |
Maintaining a consistent cash flow yield and controlled expenditure ratios signify Thermo Fisher's financial resilience and efficient capital utilization.
📊 Balance Sheet & Leverage Analysis
A robust balance sheet is essential for long-term sustainability. Thermo Fisher's leverage ratios and liquidity measures demonstrate adequate financial flexibility and low risk exposure.
| Metric | 2025 | 2024 | 2023 |
|---|---|---|---|
| Debt-to-Equity | 73.73% | 66.10% | 77.94% |
| Debt-to-Assets | 35.69% | 33.68% | 36.89% |
| Debt-to-Capital | 42.44% | 39.80% | 43.80% |
| Net Debt to EBITDA | 2.71x | 2.44x | 2.53x |
| Current Ratio | 1.89 | 1.66 | 1.75 |
| Quick Ratio | 1.53 | 1.29 | 1.39 |
| Financial Leverage | 2.07 | 1.96 | 2.11 |
The stability of financial ratios underscores Thermo Fisher's capacity to manage its debts effectively while sustaining liquidity buffers.
🌟 Fundamental Strength & Profitability
Profitability measures reflect operational efficiency, with Thermo Fisher showing strong returns and margin profiles, enhancing its growth potential.
| Metric | 2025 | 2024 | 2023 |
|---|---|---|---|
| Return on Equity | 12.61% | 12.78% | 12.83% |
| Return on Assets | 6.11% | 6.51% | 6.07% |
| Margins: Net, EBIT, EBITDA, Gross | 15.12%, 18.20%, 24.44%, 37.66% | 14.77%, 20.27%, 27.52%, 41.34% | 13.99%, 18.17%, 26.12%, 40.12% |
| Research & Development to Revenue | 3.14% | 3.24% | 3.12% |
High margins and returns, alongside investment in R&D, highlight Thermo Fisher's capacity to innovate and sustain profitability.
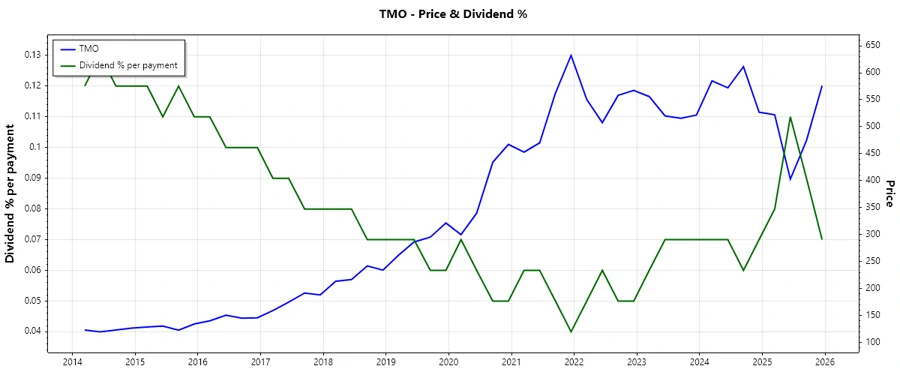
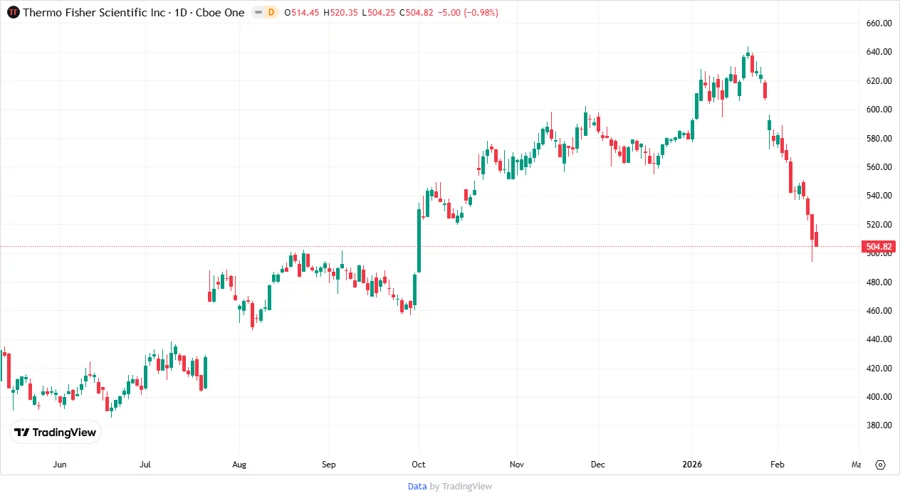
📈 Price Development
🔍 Dividend Scoring System
| Criteria | Score | Performance |
|---|---|---|
| Dividend yield | 2 | |
| Dividend Stability | 4 | |
| Dividend growth | 4 | |
| Payout ratio | 5 | |
| Financial stability | 4 | |
| Dividend continuity | 4 | |
| Cashflow Coverage | 4 | |
| Balance Sheet Quality | 5 |
Total Score: 32/40
🗣️ Rating
Thermo Fisher Scientific Inc. presents a robust dividend profile distinguished by its stability and growth potential. With low payout ratios and solid dividend growth, the stock is a solid choice for investors seeking a balance of stability and potential appreciation. The company exhibits financial prudence and a commitment to future expansion, warranting a positive investment recommendation for long-term holders.