July 01, 2025 a 12:47 pm

TMO: Dividend Analysis - Thermo Fisher Scientific Inc.
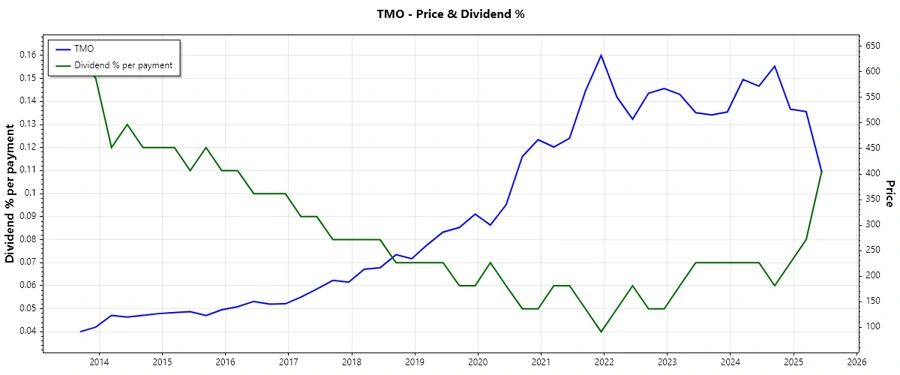
Thermo Fisher Scientific Inc. presents a uniquely stable dividend profile with a consistent streak of increases over 17 years. Despite a relatively modest dividend yield, the company's focus on sustainable growth and strong financial fundamentals provides a solid backing for its dividend strategy.
📊 Overview
Thermo Fisher operates in a dynamic sector where dividend payouts are typically balanced with reinvestment for growth. The company's current dividend yield is a modest 0.41%, with a dividend per share of $1.53. Its consistent dividend history over 17 years underscores a commitment to returning value to shareholders.
| Parameter | Value |
|---|---|
| Sector | Life Sciences & Tools |
| Dividend Yield | 0.41% |
| Current Dividend per Share | 1.53 USD |
| Dividend History | 17 years |
| Last Cut or Suspension | None |
🗣️ Dividend History
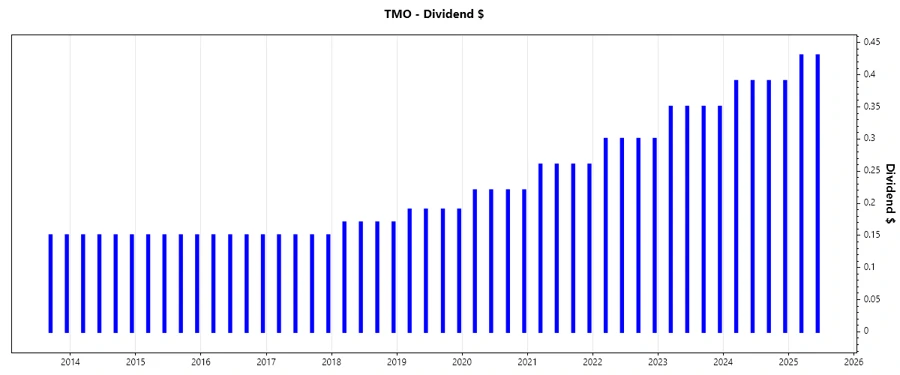
The importance of a stable dividend history cannot be overstated, as it represents the company's ongoing commitment to shareholder returns. Thermo Fisher's 17-year record of uninterrupted dividend payments is a testament to its robust financial health and operational success.
| Year | Dividend per Share (USD) |
|---|---|
| 2025 | 0.86 |
| 2024 | 1.56 |
| 2023 | 1.40 |
| 2022 | 1.20 |
| 2021 | 1.04 |
📈 Dividend Growth
Dividend growth is a critical indicator of a company’s financial health and its ability to enhance shareholder wealth. Thermo Fisher has posted a 3-year dividend growth rate of 14.47% and a 5-year rate of 15.47%, demonstrating a moderate but steady increase.
| Time | Growth |
|---|---|
| 3 years | 14.47% |
| 5 years | 15.47% |
The average dividend growth is 15.47% over 5 years. This shows moderate but steady dividend growth.
📉 Payout Ratio
Payout ratios provide insights into a company's earnings distribution via dividends. An EPS-based payout ratio of 8.85% and an FCF-based ratio of 8.57% indicate that the company retains a significant portion of its profits for reinvestment and growth, signaling financial prudence.
| Key Figure | Ratio |
|---|---|
| EPS-based | 8.85% |
| Free Cash Flow-based | 8.57% |
With such low payout ratios, Thermo Fisher maintains ample flexibility to manage its capital efficiently while still rewarding shareholders.
✅ Cashflow & Capital Efficiency
Examining cash flow and capital usage is pivotal in assessing a company's efficiency and sustainability of its dividends. Here, Thermo Fisher's data reveals prudent capital management and a reliable cash flow position.
| Metric | 2024 | 2023 | 2022 |
|---|---|---|---|
| Free Cash Flow Yield | 3.66% | 3.38% | 3.20% |
| Earnings Yield | 3.19% | 2.93% | 3.22% |
| CAPEX to Operating Cash Flow | 16.15% | 17.60% | 24.50% |
| Stock-based Compensation to Revenue | 0.70% | 0.65% | 0.68% |
| Free Cash Flow / Operating Cash Flow Ratio | 83.85% | 82.40% | 75.50% |
| Return on Invested Capital | 7.72% | 7.42% | 9.15% |
The data suggests a well-managed approach to reinvestment, underscoring Thermo Fisher's commitment to maintaining operational and financial stability.
⚠️ Balance Sheet & Leverage Analysis
A strong balance sheet indicates the fiscal health necessary for enduring financial commitments, such as dividends. Thermo Fisher’s leverage ratios are within manageable limits, reflecting prudent debt management.
| Metric | 2024 | 2023 | 2022 |
|---|---|---|---|
| Debt-to-Equity | 0.63 | 0.75 | 0.78 |
| Debt-to-Assets | 0.32 | 0.35 | 0.35 |
| Debt-to-Capital | 0.39 | 0.43 | 0.44 |
| Net Debt to EBITDA | 2.31 | 2.42 | 2.17 |
| Current Ratio | 1.66 | 1.75 | 1.48 |
| Quick Ratio | 1.29 | 1.39 | 1.15 |
| Financial Leverage | 1.96 | 2.11 | 2.21 |
The consistent debt ratios indicate a thoroughly managed debt profile, enhancing overall financial resilience and stability of the firm.
✅ Fundamental Strength & Profitability
Profitability metrics provide a comprehensive view of operational efficiency and potential for sustainable growth. Thermo Fisher demonstrates respectable results across key indicators.
| Metric | 2024 | 2023 | 2022 |
|---|---|---|---|
| Return on Equity | 12.78% | 12.83% | 15.80% |
| Return on Assets | 6.51% | 6.07% | 7.15% |
| Net Margin | 14.77% | 13.99% | 15.47% |
| EBIT Margin | 19.65% | 17.90% | 19.06% |
| EBITDA Margin | 27.52% | 25.85% | 26.59% |
| Gross Margin | 41.28% | 39.93% | 43.41% |
| R&D to Revenue | 3.26% | 3.12% | 3.28% |
The company's strong profitability indicators, particularly ROE and margins, align well with its strategic growth initiatives and dividend policies.
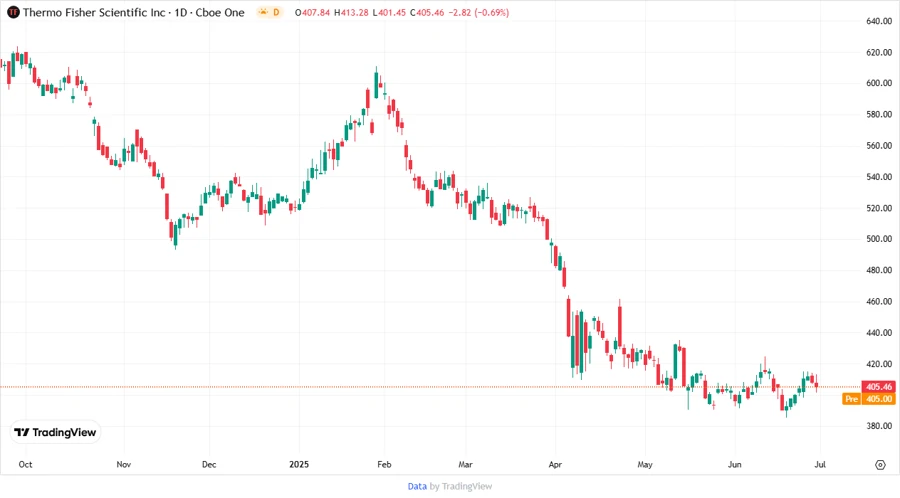
📈 Price Development
Dividend Scoring System
| Criteria | Score | Score Bar |
|---|---|---|
| Dividend Yield | 2 | |
| Dividend Stability | 5 | |
| Dividend Growth | 4 | |
| Payout Ratio | 5 | |
| Financial Stability | 4 | |
| Dividend Continuity | 5 | |
| Cashflow Coverage | 4 | |
| Balance Sheet Quality | 4 |
Total Score: 33/40
Rating
Thermo Fisher Scientific Inc. provides a solid dividend profile backed by consistent financial performance and moderate growth potential. With continued stability in operations and management practices, the company emerges as an attractive option for dividend-focused investors looking for reliable income and calculated growth.
Smart Data Insight
Master the Perfect Entry & Exit for this Stock
Don't leave your profits to chance. Historically, this stock follows specific seasonal patterns that institutional traders use to maximize returns.
- ✅ Identify the "Golden Buying Window"
- ✅ Avoid high-risk correction cycles
- ✅ Backtested data from the last 20+ years