
April 30, 2026 a 11:31 am

TKO: Dividend Analysis - TKO Group Holdings, Inc.
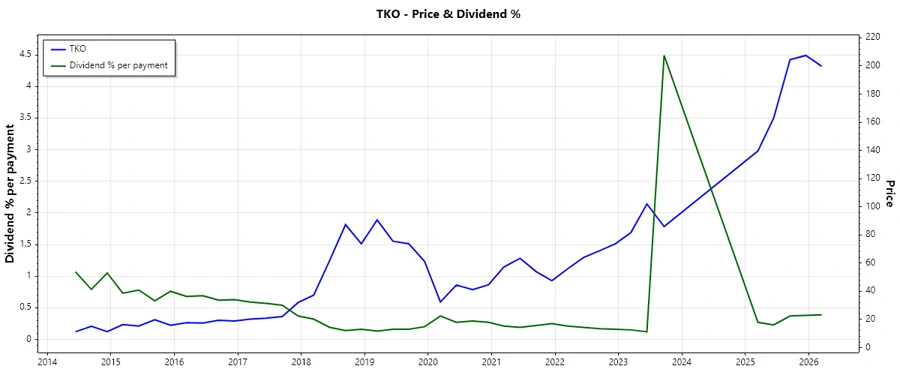
TKO Group Holdings, Inc. has been a consistent player in the dividend landscape with a solid track record over 23 years. However, with a dividend yield of 1.35% and modest growth rates, investors should weigh the stability and future potential of the dividends. It's crucial to scrutinize the company's ability to sustain and grow its payouts amidst financial challenges.
📊 Overview
TKO Group operates within a robust sector and offers a compelling dividend yield; however, the recent financials suggest some volatility in the dividend pattern. The key metrics are captured in the table below.
| Metric | Value |
|---|---|
| Sector | N/A |
| Dividend Yield | 1.35% |
| Current Dividend Per Share | 7.93 USD |
| Dividend History | 23 years |
| Last Cut or Suspension | None |
📈 Dividend History
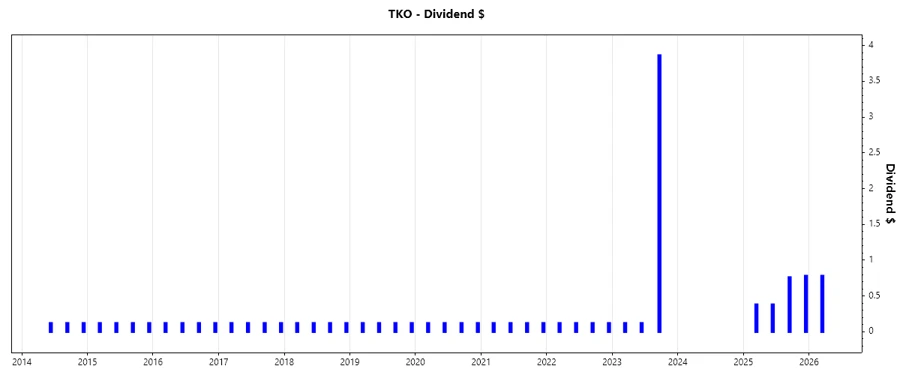
The dividend history illustrates TKO's commitment to returning value to shareholders. Sustained payment is a crucial indicator of financial health and investor confidence, yet recent fluctuations suggest ongoing reviews are necessary.
| Year | Dividend Per Share |
|---|---|
| 2026 | 0.78 USD |
| 2025 | 2.30 USD |
| 2023 | 4.10 USD |
| 2022 | 0.48 USD |
| 2021 | 0.48 USD |
📈 Dividend Growth
Dividend growth rates over 3 and 5 years are pivotal for projecting future income streams. This growth metric helps investors understand the company's capacity to enhance shareholder returns over time.
| Time | Growth |
|---|---|
| 3 years | 0.69% |
| 5 years | 0.37% |
The average dividend growth is 0.37% over 5 years. This shows moderate but steady dividend growth.
🗣️ Payout Ratio
Payout ratios offer insights into how much money a company is returning to shareholders compared to what it keeps for growth. High payout ratios might seem attractive but can be unsustainable if they exceed 100%, risking potential cuts.
| Key Figure | Ratio |
|---|---|
| EPS-based | 318.09% |
| Free Cash Flow-based | 51.05% |
The EPS-based payout ratio is alarmingly high at 318.09%, suggesting dividends were greater than earnings, which can be risky. However, the FCF-based ratio at 51.05% is more manageable and indicates that the company can cover its dividend from cash flows.
💰 Cashflow & Capital Efficiency
Analyzing cash flow and capital efficiency metrics is essential for understanding how effectively a company generates profit from its resources, which ultimately supports dividend sustainability.
| Metric | 2025 | 2024 | 2023 |
|---|---|---|---|
| Free Cash Flow Yield | 6.86% | 4.40% | 6.21% |
| Earnings Yield | 1.16% | 0.08% | -0.52% |
| CAPEX to Operating Cash Flow | 9.87% | 12.85% | 10.38% |
| Stock-based Compensation to Revenue | N/A | 3.37% | 3.41% |
| Free Cash Flow / Operating Cash Flow Ratio | 90.13% | 87.15% | 89.62% |
While FCF yield is adequate, requiring attention to operational efficiency and the capital investment's impact on the cash flow is imperative for maintaining robust dividend payments.
🔍 Balance Sheet & Leverage Analysis
Balance sheet metrics provide a window into a company's financial health, assessing debt levels compared to equity and assets, which affects long-term sustainability and risk exposure.
| Metric | 2025 | 2024 | 2023 |
|---|---|---|---|
| Debt-to-Equity | 1.09 | 0.74 | 0.74 |
| Debt-to-Assets | 26.22% | 23.90% | 23.85% |
| Debt-to-Capital | 52.09% | 42.59% | 42.42% |
| Net Debt to EBITDA | 24.71 | 37.11 | 45.67 |
| Current Ratio | 1.26 | 1.30 | 1.04 |
| Quick Ratio | 1.26 | 1.30 | 1.04 |
| Financial Leverage | 4.15 | 3.10 | 3.09 |
The debt profile is reasonably leveraged, but the increase in net debt to EBITDA warrants caution. Investors should monitor leverage metrics closely for signs of distress.
✅ Fundamental Strength & Profitability
Key profitability metrics indicate an organization's ability to yield profits from its resources, directly impacting its ability to sustain and grow dividends over time.
| Metric | 2025 | 2024 | 2023 |
|---|---|---|---|
| Return on Equity | 5.23% | 0.23% | -0.86% |
| Return on Assets | 1.26% | 0.07% | -0.28% |
| Net Margin | 4.13% | 0.34% | -2.10% |
| EBIT Margin | 17.38% | 10.11% | 26.66% |
| EBITDA Margin | 27.62% | 24.11% | 36.48% |
| Gross Margin | 49.57% | 53.90% | 59.45% |
| R&D to Revenue | N/A | N/A | N/A |
Profitability has been under pressure, with mixed signals in net margins, albeit strong EBIT and EBITDA margins. These are crucial for dividend support as they reflect the company's operational effectiveness.
🔎 Price Development
🎯 Dividend Scoring System
| Category | Points (out of 5) | Score Bar |
|---|---|---|
| Dividend Yield | 2 | |
| Dividend Stability | 3 | |
| Dividend Growth | 2 | |
| Payout Ratio | 2 | |
| Financial Stability | 3 | |
| Dividend Continuity | 4 | |
| Cashflow Coverage | 3 | |
| Balance Sheet Quality | 3 |
Total Score: 22 out of 40
✔️ Rating
Given its long dividend history, but moderate growth and high EPS-based payout ratio, TKO Group Holdings, Inc. appears to be a reasonably stable dividend player. Nonetheless, its modest yield and growth alongside potentially unsustainable payout levels suggest a cautious approach. Investors should keep an eye on financial metrics and ensure alignment with risk tolerance before making long-term commitments.
Smart Data Insight
Master the Perfect Entry & Exit for this Stock
Don't leave your profits to chance. Historically, this stock follows specific seasonal patterns that institutional traders use to maximize returns.
- ✅ Identify the "Golden Buying Window"
- ✅ Avoid high-risk correction cycles
- ✅ Backtested data from the last 20+ years