September 29, 2025 a 03:15 am
TJX: Trend and Support & Resistance Analysis - The TJX Companies, Inc.
The TJX Companies, Inc., operating in the off-price apparel and home fashions retail sector, demonstrates a resilient business model with a vast presence across the U.S., Canada, Europe, and Australia. Despite the volatile market conditions, TJX has exhibited steady growth in its stock price, driven by its robust expansion and diversified product offerings. The recent data suggests a promising uptick in its market performance, making it a stock worth considering for growth-focused investors.
Trend Analysis
| Date | Close Price | Trend |
|---|---|---|
| 2025-09-26 | $143.09 | ▲ |
| 2025-09-25 | $141.46 | ▲ |
| 2025-09-24 | $140.44 | ▲ |
| 2025-09-23 | $139.72 | ▲ |
| 2025-09-22 | $139.41 | ▲ |
| 2025-09-19 | $139.78 | ▲ |
| 2025-09-18 | $139.93 | ▲ |
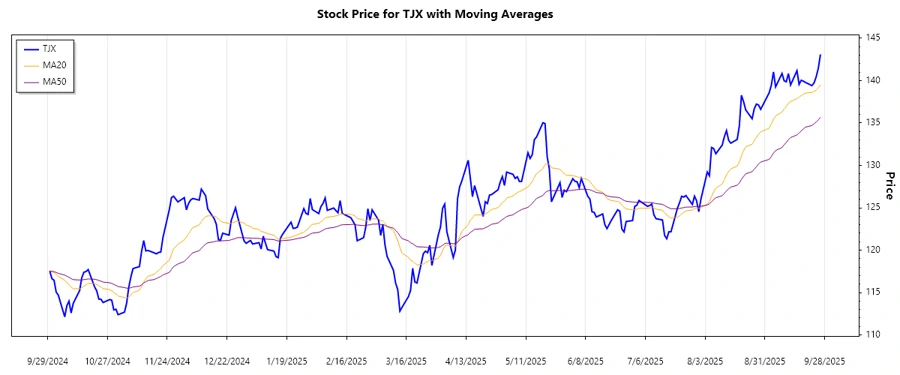
The trend analysis indicates an upward trend for TJX stock in the last week based on closing prices. With EMA20 above EMA50, the technical indicators suggest bullish momentum.
Support and Resistance
| Zone Type | Price Range | Direction |
|---|---|---|
| Support Zone 1 | $137 - $139 | ▼ |
| Support Zone 2 | $133 - $135 | ▼ |
| Resistance Zone 1 | $142 - $144 | ▲ |
| Resistance Zone 2 | $146 - $148 | ▲ |
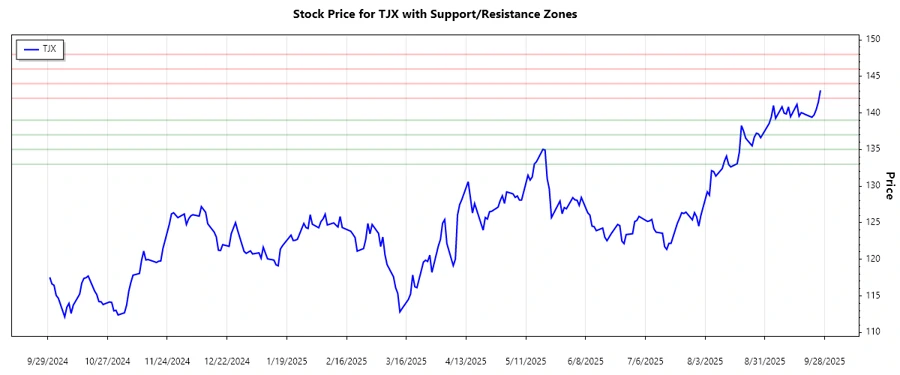
The current price is near the resistance zone of $142 - $144, indicating that further gains may encounter selling pressure.
Conclusion
In conclusion, the TJX Companies, Inc. stock showcases a bullish trend with promising upward momentum. The proximity to the resistance zone suggests potential challenges ahead, but breaking through this level may unlock further upside potential. Investors should watch for changes in volume and momentum for confirmation of continued gains. The company's strong financials and expanding market reach provide a solid foundation for sustained growth, though the stock is likely to be influenced by broader economic conditions and retail sector dynamics.
Smart Data Insight
Master the Perfect Entry & Exit for this Stock
Don't leave your profits to chance. Historically, this stock follows specific seasonal patterns that institutional traders use to maximize returns.
- ✅ Identify the "Golden Buying Window"
- ✅ Avoid high-risk correction cycles
- ✅ Backtested data from the last 20+ years