July 17, 2025 a 03:15 am

TJX: Trend and Support & Resistance Analysis - The TJX Companies, Inc.
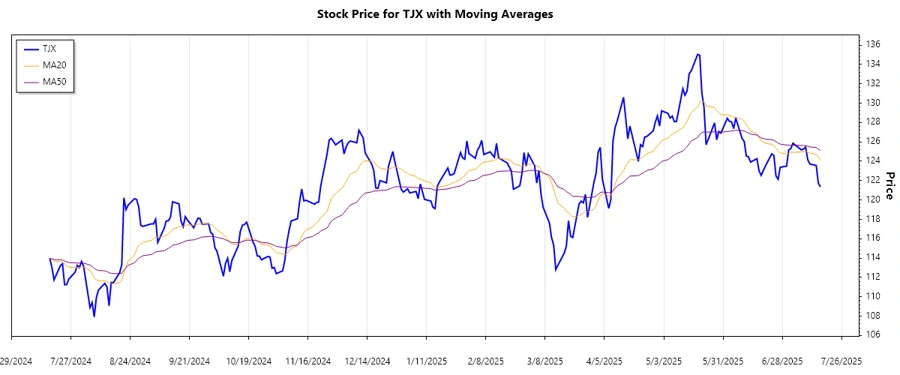
The TJX Companies, Inc. operates within a diverse and competitive retail environment offering off-price apparel and home fashion. Over the past months, the stock has shown significant fluctuations impacted by market trends and company performance. Evaluating key trends and support & resistance zones can provide insights into potential future movements.
Trend Analysis
Based on the calculated EMA20 and EMA50 from the provided data, the following trend analysis provides insight into the recent movements of TJX stock.
| Date | Closing Price | Trend |
|---|---|---|
| 2025-07-16 | 121.35 | ▼ Abwärtstrend |
| 2025-07-15 | 121.74 | ▼ Abwärtstrend |
| 2025-07-14 | 123.56 | ▼ Abwärtstrend |
| 2025-07-11 | 123.71 | ▼ Abwärtstrend |
| 2025-07-10 | 124.16 | ▼ Abwärtstrend |
| 2025-07-09 | 125.45 | ▼ Abwärtstrend |
| 2025-07-08 | 125.26 | ▼ Abwärtstrend |
The recent trend for TJX indicates a consistent downtrend marked by the EMA20 moving below the EMA50. This suggests bearish market conditions.
Support- and Resistance
Analyzing the recent price movements, we identify potential support and resistance zones crucial for understanding stock behavior.
| Zone | From | To |
|---|---|---|
| Resistance 1 | 125.60 | 126.00 |
| Resistance 2 | 127.30 | 127.70 |
| Support 1 | 120.90 | 121.30 |
| Support 2 | 119.10 | 119.50 |
The current price is approaching the nearest support zone, indicating potential for a bounce or further decline depending on market sentiment.

Conclusion
Overall, The TJX Companies, Inc. stock demonstrates a current downward trend as observed from the EMA analysis. With the present pricing nearing support zones, it offers a potential opportunity for traders looking for a reversal or confirmation of the trend. Investors must consider broader economic conditions and company performance metrics before making investment decisions. Continuous monitoring of support and resistance levels will be key in anticipating stock behavior for TJX in the near future.
Smart Data Insight
Master the Perfect Entry & Exit for this Stock
Don't leave your profits to chance. Historically, this stock follows specific seasonal patterns that institutional traders use to maximize returns.
- ✅ Identify the "Golden Buying Window"
- ✅ Avoid high-risk correction cycles
- ✅ Backtested data from the last 20+ years