November 08, 2025 a 04:44 pm

TJX: Fibonacci Analysis - The TJX Companies, Inc.
The TJX stock has been showing a noticeable upward trend in the recent months, driven by solid growth in the retail segment. The company's ability to attract consumers with discounted prices has kept its revenue stream robust despite economic headwinds. This trend might continue, given the healthy consumer spending pattern observed in the apparel and home fashion sectors. Investors should be cautious, however, as market volatility could impact retail stocks at any time.
Fibonacci Analysis
| Information | Details |
|---|---|
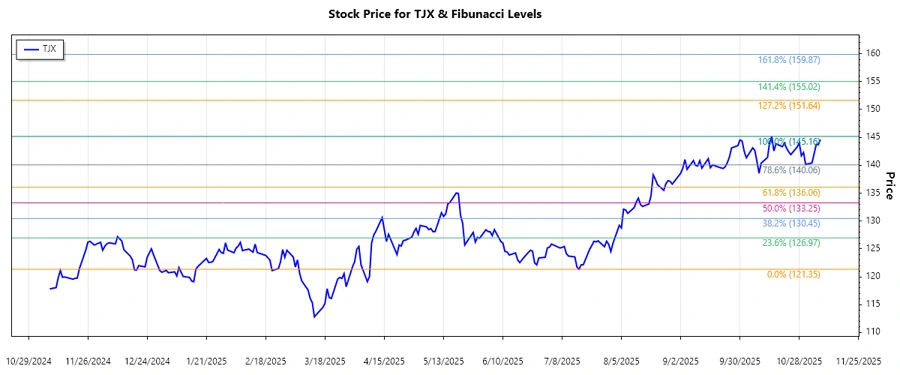
| Trend Start Date | 2025-07-17 |
| Trend End Date | 2025-11-07 |
| High Point (Price/Date) | $145.16 / 2025-10-15 |
| Low Point (Price/Date) | $121.35 / 2025-07-16 |
| Fibonacci Levels |
|
| Current Retracement Zone | 0.5 |
| Technical Interpretation | The stock is in the 0.5 retracement zone, suggesting a potential support level. |
Conclusion
In conclusion, TJX's current upward trend reflects its strong platform in the off-price retail segment, backed by steady consumer demand. Although it is trading at a critical retracement level, signaling potential support, investors should remain vigilant as external market factors could induce volatility. The trend's stability implies significant upside potential, yet caution regarding potential market corrections is warranted. Analysts should closely monitor consumer spending patterns, as shifts may directly impact TJX’s performance. Overall, TJX remains a solid performer with substantial growth prospects, primarily if current economic conditions hold.
Smart Data Insight
Master the Perfect Entry & Exit for this Stock
Don't leave your profits to chance. Historically, this stock follows specific seasonal patterns that institutional traders use to maximize returns.
- ✅ Identify the "Golden Buying Window"
- ✅ Avoid high-risk correction cycles
- ✅ Backtested data from the last 20+ years