April 28, 2026 a 07:31 am

TJX: Dividend Analysis - The TJX Companies, Inc.
📊 The TJX Companies, Inc., a leader in the retail industry, presents a robust dividend profile that appeals to long-term investors. With a significant market capitalization and a consistent history of dividend payments over 40 years, it's noteworthy for its yield and growth potential. Strategic financial management and sustainable payout ratios further enhance its attractiveness. However, potential investors should remain vigilant about market conditions and company performance.
Overview
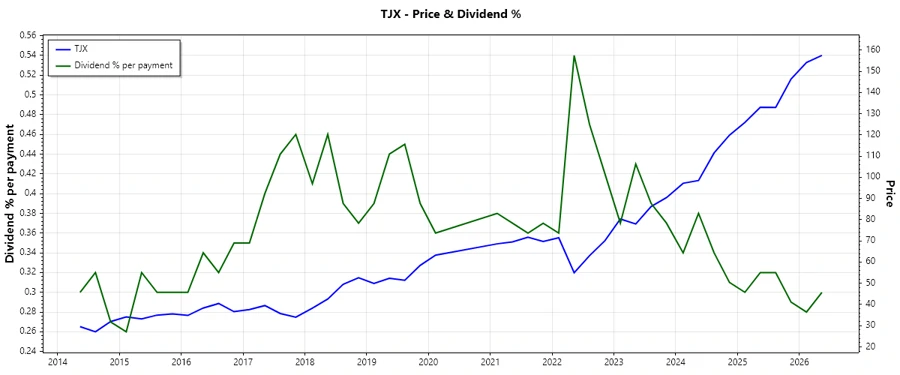
📈 The TJX Companies, Inc. operates within the retail sector, offering a stable dividend yield of 1.11%. The company has maintained a consistent and growing dividend per share, currently at $1.64. Its impressive 40-year dividend history reflects reliability and investor confidence, while no recent cuts or suspensions were noted, showcasing its commitment to shareholder returns.
| Metric | Value |
|---|---|
| Sector | Retail |
| Dividend yield | 1.11% |
| Current dividend per share | $1.64 |
| Dividend history | 40 years |
| Last cut or suspension | None |
Dividend History
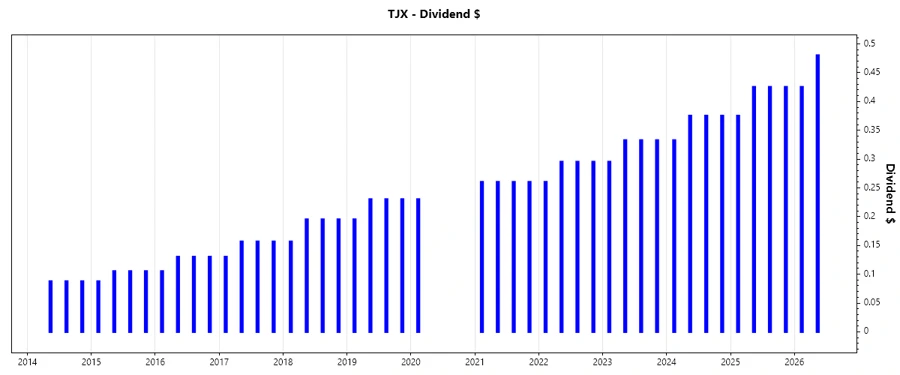
🗣️ Understanding dividend history and trends highlights the company's resilience and long-term commitment to its shareholders. Such data can provide insights into management's confidence in the company's future earnings.
| Year | Dividend per Share (USD) |
|---|---|
| 2026 | 0.905 |
| 2025 | 1.650 |
| 2024 | 1.4575 |
| 2023 | 1.2925 |
| 2022 | 1.145 |
Dividend Growth
📈 Examining dividend growth rates over 3 and 5 years not only shows management's past commitment to increasing shareholder value but also helps gauge future growth potential.
| Time | Growth |
|---|---|
| 3 years | 12.95% |
| 5 years | 48.30% |
The average dividend growth is 48.30% over 5 years. This shows moderate but steady dividend growth.
Payout Ratio
🧐 Payout ratios express how well earnings and cash flows support dividends. A healthy range indicates sustainability and potential for future growth.
| Key figure ratio | Value |
|---|---|
| EPS-based | 33.53% |
| Free cash flow-based | 37.44% |
With an EPS payout ratio of 33.53% and a free cash flow payout ratio of 37.44%, The TJX Companies, Inc. exhibits an ability to reliably cover dividends while retaining earnings for growth.
Cashflow & Capital Efficiency
📊 Examining cash flows and efficiency metrics evaluates operational success and strategic capital deployment.
| Metric | 2026 | 2025 | 2024 |
|---|---|---|---|
| Free Cash Flow Yield | 2.88% | 2.98% | 3.99% |
| Earnings Yield | 3.26% | 3.46% | 4.11% |
| CAPEX to Operating Cash Flow | 28.72% | 31.36% | 28.43% |
| Stock-based Compensation to Revenue | 0.22% | 0.32% | 0.30% |
| Free Cash Flow / Operating Cash Flow Ratio | 71.28% | 68.64% | 71.57% |
| Return on Invested Capital | 21.50% | 21.13% | 20.78% |
The company's cash flow stability and capital efficiency remain strong, indicating robust operational performance and prudent capital management.
Balance Sheet & Leverage Analysis
🔍 Evaluating leverage gives insight into debt management and financial liquidity, important for assessing long-term viability.
| Metric | 2026 | 2025 | 2024 |
|---|---|---|---|
| Debt-to-Equity | 132.37% | 152.25% | 171.76% |
| Debt-to-Assets | 37.71% | 40.25% | 42.16% |
| Debt-to-Capital | 56.97% | 60.36% | 63.20% |
| Net Debt to EBITDA | 0.88x | 0.97x | 0.99x |
| Current Ratio | 1.14 | 1.18 | 1.21 |
| Quick Ratio | 0.59 | 0.60 | 0.64 |
| Financial Leverage | 3.51 | 3.78 | 4.07 |
Moderate levels of debt and leverage, coupled with sound liquidity ratios, underscore the company's stable financial base and careful management of liabilities.
Fundamental Strength & Profitability
💼 Analyzing profitability ratios like ROE and margins uncovers operational efficiency and competitive standing.
| Metric | 2026 | 2025 | 2024 |
|---|---|---|---|
| Return on Equity (ROE) | 53.92% | 57.95% | 61.27% |
| Return on Assets (ROA) | 15.36% | 15.32% | 15.04% |
| Net Margin | 9.10% | 8.63% | 8.25% |
| EBIT Margin | 12.09% | 11.64% | 11.15% |
| EBITDA Margin | 14.16% | 13.60% | 12.93% |
| Gross Margin | 30.96% | 30.60% | 30.00% |
| Research & Development to Revenue | 0% | 0% | 0% |
The retailer's strong figure in profitability measurements, such as ROE and margins, depict its well-managed operations and resource utilization.
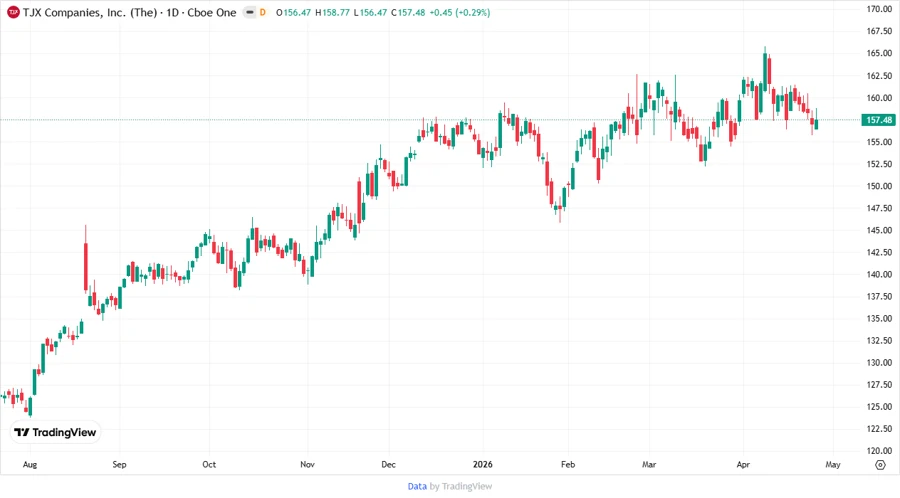
Price Development
Dividend Scoring System
⭐ Below is a scoring evaluation based on several aspects of dividend sustainability and financial health.
| Criterion | Score (out of 5) | Visual Score |
|---|---|---|
| Dividend yield | 3 | |
| Dividend Stability | 5 | |
| Dividend growth | 4 | |
| Payout ratio | 4 | |
| Financial stability | 3 | |
| Dividend continuity | 5 | |
| Cashflow Coverage | 4 | |
| Balance Sheet Quality | 3 |
Total Score: 31/40
Rating
🔥 Overall, The TJX Companies, Inc. is a robust dividend payer with strong historical growth and stability metrics. With an impressive total score of 31 out of 40, this stock is well-suited for income-focused investors. The company's stable financials, significant dividend history, and consistent return suggest that adding it to a diversified portfolio could enhance yield reliability and capital appreciation over the long term.