October 12, 2025 a 03:31 am
TJX: Dividend Analysis - The TJX Companies, Inc.
The TJX Companies, Inc. stands as a robust player in the retail sector, fortified by a longstanding tradition of dividend distributions spanning 39 years. Despite the challenges faced with a temporary suspension in 2020, TJX has demonstrated resilience through a recuperative growth phase, underpinned by strategic financial management and a clear commitment to shareholder returns.
📊 Overview
TJX operates in the consumer retail sector, known for its attractive dividend yield and consistent payout history. Below is a concise summary of their dividend profile:
| Metric | Value |
|---|---|
| Sector | Retail |
| Dividend Yield | 1.18% |
| Current Dividend per Share | $1.46 USD |
| Dividend History | 39 years |
| Last Cut or Suspension | 2020 |
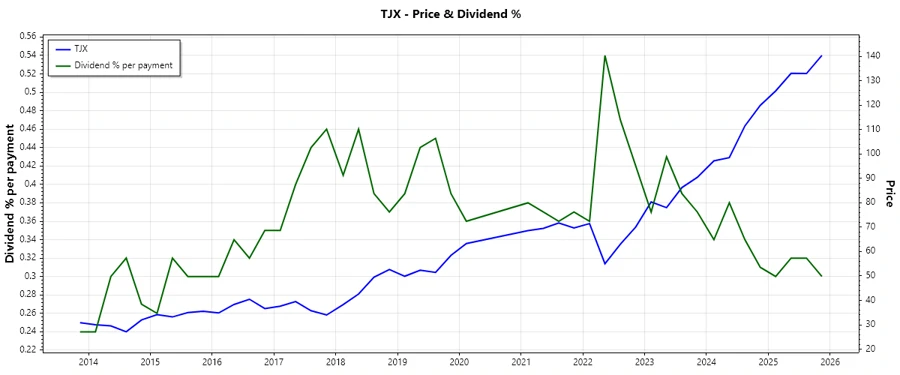
🗣️ Dividend History
TJX has cultivated a commendable track record of consistent dividend distributions over nearly four decades. This stability is a testament to its financial resilience and capability to sustain shareholder value across economic cycles.
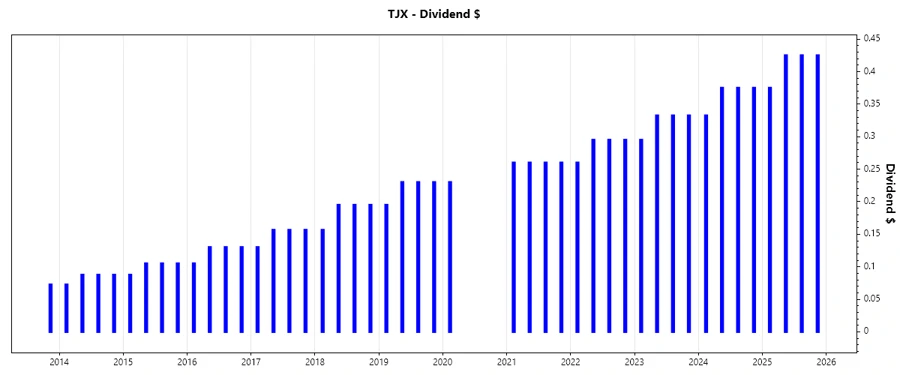
| Year | Dividend per Share (USD) |
|---|---|
| 2025 | 1.65 |
| 2024 | 1.4575 |
| 2023 | 1.2925 |
| 2022 | 1.145 |
| 2021 | 1.04 |
📈 Dividend Growth
Monitoring dividend growth is pivotal for assessing the future potential of passive income. TJX’s dividend growth over three and five-year horizons reflects a strategic enhancement in shareholder distributions.
| Time | Growth |
|---|---|
| 3 years | 11.91% |
| 5 years | 10.49% |
The average dividend growth is 10.49% over 5 years. This shows moderate but steady dividend growth.
✅ Payout Ratio
The payout ratio is a critical indicator of dividend sustainability. Examining both earnings and free cash flow-based metrics offers a comprehensive view of TJX’s dividend reliability.
| Key figure | Ratio |
|---|---|
| EPS-based | 33.13% |
| Free cash flow-based | 40.24% |
The EPS payout ratio of 33.13% indicates a conservative approach, whereas the FCF payout ratio at 40.24% demonstrates a robust capacity to cover dividends through cash flow operations.
⚠️ Cashflow & Capital Efficiency
Assessing cash flow and capital efficiency is paramount to evaluating the operational strength and strategic capital allocation of TJX.
| Year | 2025 | 2024 | 2023 |
|---|---|---|---|
| Free Cash Flow Yield | 2.98% | 3.88% | 2.75% |
| Earnings Yield | 3.46% | 4.00% | 3.66% |
| CAPEX to Operating Cash Flow | 31.36% | 28.43% | 35.68% |
| Stock-based Compensation to Revenue | 0.32% | 0.30% | 0.24% |
| Free Cash Flow / Operating Cash Flow Ratio | 68.64% | 71.57% | 64.32% |
The cash flow metrics demonstrate manageable capital expenditure and a favorable free cash flow conversion, highlighting efficiency in capital allocation.
📉 Balance Sheet & Leverage Analysis
Evaluating leverage and balance sheet health provides insight into TJX’s financial stability and debt management with notable coverage and solvency ratios.
| Year | 2025 | 2024 | 2023 |
|---|---|---|---|
| Debt-to-Equity | 1.52 | 1.72 | 2.00 |
| Debt-to-Assets | 40.25% | 42.16% | 44.95% |
| Debt-to-Capital | 60.36% | 63.20% | 66.69% |
| Net Debt to EBITDA | 1.08 | 0.99 | 1.30 |
| Current Ratio | 1.17 | 1.21 | 1.21 |
| Quick Ratio | 0.60 | 0.64 | 0.64 |
The company maintains a sound leverage position, though there’s a slight upward trend in debt ratios that may require monitoring for long-term solvency.
📊 Fundamental Strength & Profitability
By scrutinizing profitability and efficiency metrics, we gain clarity on TJX’s operational prowess and value creation mechanisms.
| Year | 2025 | 2024 | 2023 |
|---|---|---|---|
| Return on Equity | 57.95% | 61.27% | 54.97% |
| Return on Assets | 15.32% | 15.04% | 12.34% |
| Net Profit Margin | 8.63% | 8.25% | 7.00% |
| EBIT Margin | 11.64% | 11.15% | 9.45% |
| Gross Margin | 30.60% | 30.00% | 27.61% |
| Research & Development to Revenue | 0.00% | 0.00% | 0.00% |
High return on equity and consistent profit margins underscore TJX’s robust profitability framework, contributing to sustained growth and shareholder returns.
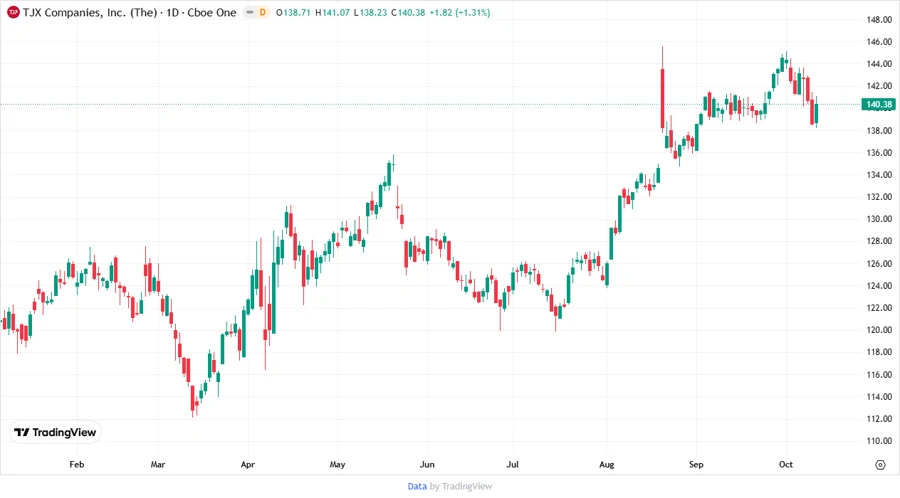
Price Development
📈 Dividend Scoring System
| Category | Score (1-5) | Graphic Representation |
|---|---|---|
| Dividend Yield | 3 | |
| Dividend Stability | 5 | |
| Dividend Growth | 4 | |
| Payout Ratio | 4 | |
| Financial Stability | 4 | |
| Dividend Continuity | 5 | |
| Cashflow Coverage | 3 | |
| Balance Sheet Quality | 3 |
Total Score: 31/40
Rating
TJX holds a formidable position within the dividend sphere as a reliable and prudent option for investors seeking long-term income growth. Despite moderate yield levels, its solid financial foundation and promising dividend practices offer compelling reasons to consider this stock for dividend-focused portfolios.
Smart Data Insight
Master the Perfect Entry & Exit for this Stock
Don't leave your profits to chance. Historically, this stock follows specific seasonal patterns that institutional traders use to maximize returns.
- ✅ Identify the "Golden Buying Window"
- ✅ Avoid high-risk correction cycles
- ✅ Backtested data from the last 20+ years