June 06, 2025 a 07:46 am


TJX: Dividend Analysis - The TJX Companies, Inc.
The TJX Companies, Inc. is a prominent player in the retail sector with robust dividend metrics, backed by an impressive 39-year history of dividend payments. The company's current dividend yield stands at 1.17%, which, while modest, reflects its consistent commitment to shareholder returns. With a market capitalization exceeding $142 billion, TJX remains a formidable force, showcasing potential areas for investment and growth.
Overview
| Key Metrics | Details |
|---|---|
| Sector | Retail |
| Dividend Yield | 1.17% |
| Current Dividend per Share | 1.461 USD |
| Dividend History | 39 years |
| Last Cut or Suspension | None |
Dividend History
Understanding a company's dividend history gives insight into its consistency and reliability in returning profits to shareholders. TJX has maintained dividends for 39 years, demonstrating financial stability and shareholder commitment.
| Year | Dividend per Share (USD) |
|---|---|
| 2025 | 0.800 |
| 2024 | 1.4575 |
| 2023 | 1.2925 |
| 2022 | 1.1450 |
| 2021 | 1.0400 |
Dividend Growth
Examining the dividend growth rate provides a perspective on how a company's dividends have evolved over time. Over the past three and five years, TJX has delivered a steady growth in dividends, emphasizing its strong future payout potential.
| Time | Growth |
|---|---|
| 3 years | 11.91% |
| 5 years | 10.49% |
The average dividend growth is 10.49% over 5 years. This shows moderate but steady dividend growth, which is promising for income-focused investors.
Payout Ratio
The payout ratio is a critical indicator of sustainability of a company’s dividend policy. TJX’s ratio is favorably positioned with an EPS-based payout of 34.24% and an FCF-based payout of 43.15%. These factors reflect a prudent balance between rewarding shareholders and retaining earnings for growth.
| Key figure | Ratio |
|---|---|
| EPS-based | 34.24% |
| Free cash flow-based | 43.15% |
The EPS payout ratio of 34.24% and an FCF payout ratio of 43.15% indicate a strong, sustainable dividend payout policy.
Cashflow & Capital Efficiency
Cashflow and capital efficiency are vital for evaluating a company's operational effectiveness and financial health. TJX demonstrates balanced efficiency with satisfactory Free Cash Flow and Earnings Yields.
| Metric | 2023 | 2024 | 2025 |
|---|---|---|---|
| Free Cash Flow Yield | 2.75% | 3.88% | 2.98% |
| Earnings Yield | 3.66% | 4.00% | 3.46% |
| CAPEX to Operating Cash Flow | 35.68% | 28.43% | 31.36% |
| Stock-based Compensation to Revenue | 0.24% | 0.30% | 0.32% |
| Free Cash Flow / Operating Cash Flow Ratio | 64.32% | 71.57% | 68.64% |
TJX shows strong cash flow generation and efficient capital use, supporting its dividend policy and future investment capabilities.
Balance Sheet & Leverage Analysis
A solid balance sheet is crucial for enduring market volatility. TJX's leverage ratios indicate a well-managed liability structure, though the debt-to-equity ratio warrants monitoring.
| Metric | 2023 | 2024 | 2025 |
|---|---|---|---|
| Debt-to-Equity | 2.00 | 1.72 | 1.52 |
| Debt-to-Assets | 44.95% | 42.16% | 40.25% |
| Debt-to-Capital | 66.69% | 63.20% | 60.36% |
| Net Debt to EBITDA | 1.22 | 0.99 | 0.97 |
| Current Ratio | 1.21 | 1.21 | 1.18 |
| Quick Ratio | 0.64 | 0.64 | 0.60 |
| Financial Leverage | 4.45 | 4.07 | 3.78 |
The analysis suggests TJX maintains a balance between leveraging and ensuring liquidity, enhancing its creditworthiness and stability.
Fundamental Strength & Profitability
Key profitability indicators such as Return on Equity and asset efficiency provide insights into TJX's operational prowess. Profitable margins underpin robust operational control and market position.
| Metric | 2023 | 2024 | 2025 |
|---|---|---|---|
| Return on Equity | 54.97% | 61.27% | 57.95% |
| Return on Assets | 12.34% | 15.04% | 15.32% |
| Net Margin | 7.00% | 8.25% | 8.63% |
| EBIT Margin | 9.45% | 11.15% | 11.64% |
| EBITDA Margin | 11.95% | 12.93% | 13.60% |
| Gross Margin | 27.61% | 30.00% | 30.60% |
TJX's formidable profit margins and strong returns indicate a capable management and competitive market standing.
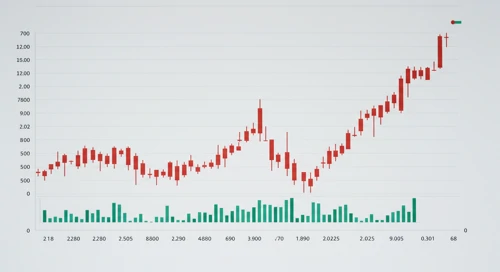
Price Development
Dividend Scoring System
| Category | Description | Score |
|---|---|---|
| Dividend yield | Moderate | 3 |
| Dividend Stability | Very Strong | 5 |
| Dividend growth | Steady | 4 |
| Payout ratio | Sustainable | 4 |
| Financial stability | Good | 4 |
| Dividend continuity | Unbroken | 5 |
| Cashflow Coverage | Adequate | 3 |
| Balance Sheet Quality | Strong | 4 |
Total Score: 32/40
Rating
The TJX Companies, Inc. stands out as a solid investment prospect with a robust dividend history, steady growth, and a strong balance sheet, making it an attractive choice for income-oriented investors. With a total score of 32 out of 40, the company reflects sound fundamental performance and reliable dividend payouts, supporting a continued buy stance for investors seeking long-term stable returns.
Smart Data Insight
Master the Perfect Entry & Exit for this Stock
Don't leave your profits to chance. Historically, this stock follows specific seasonal patterns that institutional traders use to maximize returns.
- ✅ Identify the "Golden Buying Window"
- ✅ Avoid high-risk correction cycles
- ✅ Backtested data from the last 20+ years