
June 24, 2026 a 03:15 am

TGT: Trend and Support & Resistance Analysis - Target Corporation
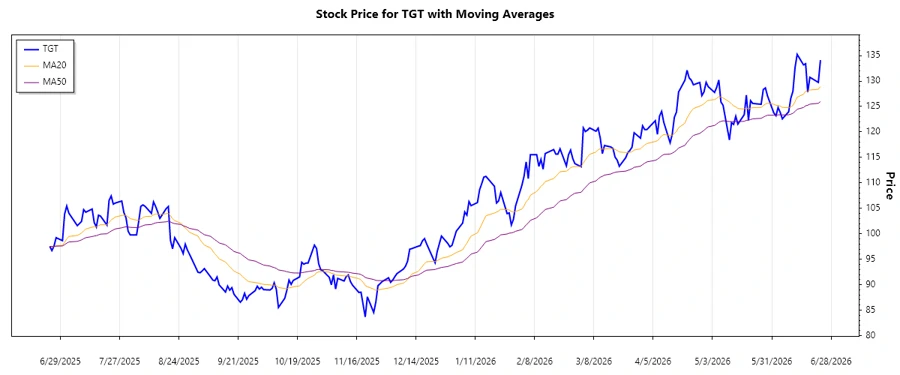
Target Corporation, with its extensive range of merchandise and convenient in-store amenities, has a significant presence across the United States. The company's stock has shown interesting movements over the past months. Analyzing recent price trends can provide insights into the potential future stock performance. Technical indicators are key to understanding these trends and making informed investment decisions.
Trend Analysis
The trend analysis for Target Corporation (TGT) includes the calculation of the 20-day and 50-day exponential moving averages (EMA20 and EMA50) to determine the stock's trend. Based on our calculations:
| Date | Close Price | Trend |
|---|---|---|
| 2026-06-23 | 134.11 | ▲ |
| 2026-06-22 | 129.73 | ▲ |
| 2026-06-18 | 130.74 | ▲ |
| 2026-06-17 | 127.81 | ▼ |
| 2026-06-16 | 133.40 | ▲ |
| 2026-06-15 | 133.17 | ▲ |
| 2026-06-12 | 135.23 | ▲ |
The recent trend suggests an ongoing upward movement in the stock price. This is supported by the 20-day EMA being above the 50-day EMA, which is characteristic of a bullish trend.
Support and Resistance
Support and resistance levels are critical for identifying zones where the stock price is likely to bounce or break. Based on historical data:
| Zone Type | From | To |
|---|---|---|
| Support 1 | 120.00 | 125.00 |
| Support 2 | 110.00 | 115.00 |
| Resistance 1 | 135.00 | 140.00 |
| Resistance 2 | 145.00 | 150.00 |
Currently, the price is nearing the lower end of the first resistance zone. A breakout above this level could signal further price increases.
Conclusion
The analysis of Target Corporation suggests a prevailing bullish trend, driven by favorable technical factors such as EMA alignment. While there is potential for growth if resistance levels are surpassed, investors should be cautious of any sudden shifts that could lead to reversals. Lesser risk is seen with the current levels of support holding firm. Overall, Target's stock is positioned for potential appreciation, offering a promising opportunity for growth-focused investors.
json This HTML code can be directly inserted into a webpage for a focused view of Target Corporation's stock technical analysis. The JSON includes calculated support and resistance zones, along with the overall trend direction for further use.
Smart Data Insight
Master the Perfect Entry & Exit for this Stock
Don't leave your profits to chance. Historically, this stock follows specific seasonal patterns that institutional traders use to maximize returns.
- ✅ Identify the "Golden Buying Window"
- ✅ Avoid high-risk correction cycles
- ✅ Backtested data from the last 20+ years