
May 26, 2026 a 08:15 am
TGT: Trend and Support & Resistance Analysis - Target Corporation
Target Corporation is a major player in retail, known for its diversified product range. As of recently, its stocks have encountered fluctuations reflective of prevailing market conditions. This analysis will showcase current trends and identify support and resistance zones, offering insights for potential investment considerations.
Trend Analysis
| Date | Closing Price | Trend |
|---|---|---|
| May 22, 2026 | $125.60 | ▲ |
| May 21, 2026 | $126.15 | ▲ |
| May 20, 2026 | $122.33 | ▼ |
| May 19, 2026 | $127.24 | ▲ |
| May 18, 2026 | $123.40 | ▼ |
| May 15, 2026 | $121.54 | ▼ |
| May 14, 2026 | $123.08 | ▲ |
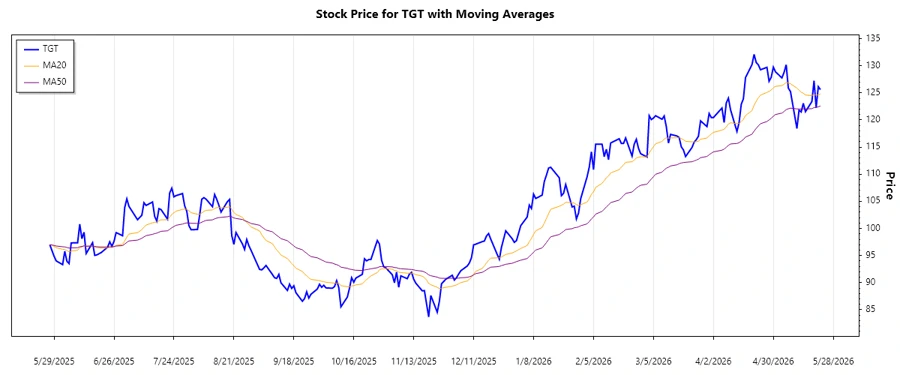
The EMA20 and EMA50 calculations reveal a recent transition into an uptrend phase. The recent ascending slope indicates improving market sentiment, underpinned by supportive price action which can continue if momentum persists. Such shifts highlight opportunities for potential gains if support levels hold.
Support- and Resistance
| Zone Type | From | To |
|---|---|---|
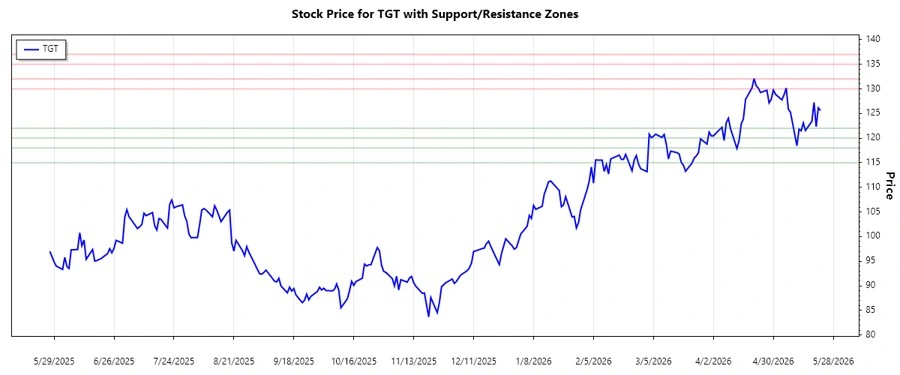
| Support Zone 1 | $120.00 | $122.00 |
| Support Zone 2 | $115.00 | $118.00 |
| Resistance Zone 1 | $130.00 | $132.00 |
| Resistance Zone 2 | $135.00 | $137.00 |
The current price sits near the upper support zone, indicating potential for price stabilization or rebound if buying pressure takes effect. Being within proximity to such zones also suggests caution against potential reversals at resistance levels.
Conclusion
The analysis of Target Corporation’s stock data suggests a cautiously optimistic outlook with the potential for upward movement grounded on its recent trend and support levels. However, resistance barriers must be scrutinized as they could halt progress. As with any investment, a balanced approach, weighing both market sentiment and fundamental factors, remains key. Continuing to monitor these technical zones will be essential for making informed decisions.
Smart Data Insight
Master the Perfect Entry & Exit for this Stock
Don't leave your profits to chance. Historically, this stock follows specific seasonal patterns that institutional traders use to maximize returns.
- ✅ Identify the "Golden Buying Window"
- ✅ Avoid high-risk correction cycles
- ✅ Backtested data from the last 20+ years