October 01, 2025 a 08:16 am
TGT: Trend and Support & Resistance Analysis - Target Corporation
The Target Corporation, with approximately 2,000 stores, plays a crucial role in the US retail sector. Their diverse offerings including food assortments, home décor, and fashion, paired with exclusive in-store amenities and strong online presence, make it a formidable competitor. Despite the volatile economic landscape, the company demonstrates resilience and adaptability.
Trend Analysis
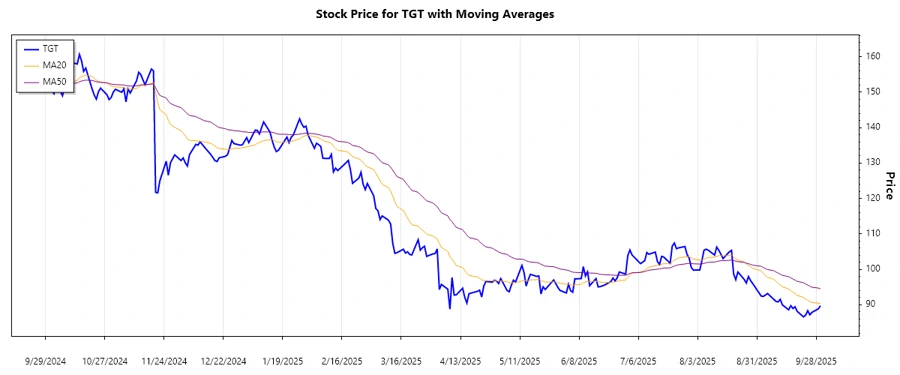
Analyzing the recent trading activity of Target Corporation, we calculate the EMA20 and EMA50 to identify the current trend. The latest data reveals:
| Date | Closing Price | Trend |
|---|---|---|
| 2025-09-30 | $89.70 | ▼ Abwärtstrend |
| 2025-09-29 | $88.83 | ▼ Abwärtstrend |
| 2025-09-26 | $87.85 | ▼ Abwärtstrend |
| 2025-09-25 | $87.14 | ▼ Abwärtstrend |
| 2025-09-24 | $88.31 | ▼ Abwärtstrend |
| 2025-09-23 | $87.05 | ▼ Abwärtstrend |
| 2025-09-22 | $86.56 | ▼ Abwärtstrend |
Currently, the EMA20 is below the EMA50, indicating a sustained bearish trend.
Support- and Resistance
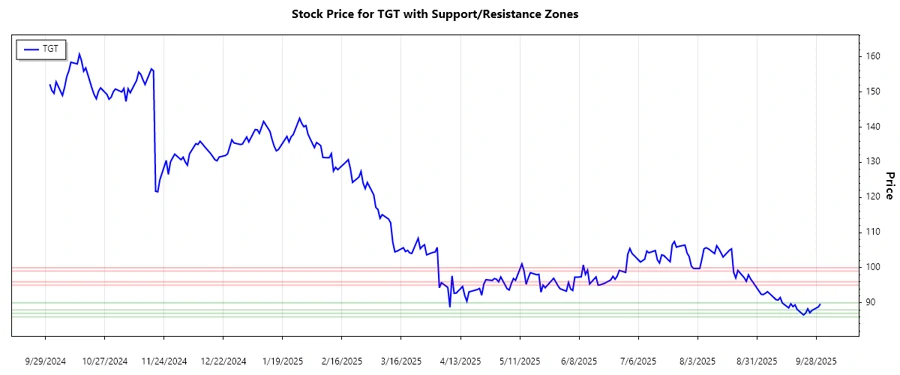
Upon reviewing the support and resistance levels, two critical zones have been identified:
| Zone | From | To | Type |
|---|---|---|---|
| Support 1 | $86.00 | $87.00 | ▼ Unterstützung |
| Support 2 | $88.00 | $90.00 | ▼ Unterstützung |
| Resistance 1 | $95.00 | $96.00 | ▲ Widerstand |
| Resistance 2 | $99.00 | $100.00 | ▲ Widerstand |
Currently, the stock price is within the first support zone, suggesting potential resistance at $87.00.
Conclusion
Target Corporation's current trend suggests a bearish sentiment among traders, with the price consistently below its moving averages. However, its presence in the support zone offers potential for a near-term recovery. Analysts should monitor the stock closely for a break below the current support levels or if it bounces back, testing the resistance zones. Investors should weigh the ongoing market volatility, but Target's solid market position could provide opportunities for long-term gains amidst temporary downturns.
Smart Data Insight
Master the Perfect Entry & Exit for this Stock
Don't leave your profits to chance. Historically, this stock follows specific seasonal patterns that institutional traders use to maximize returns.
- ✅ Identify the "Golden Buying Window"
- ✅ Avoid high-risk correction cycles
- ✅ Backtested data from the last 20+ years