October 13, 2025 a 10:15 am

TGT: Fibonacci Analysis - Target Corporation
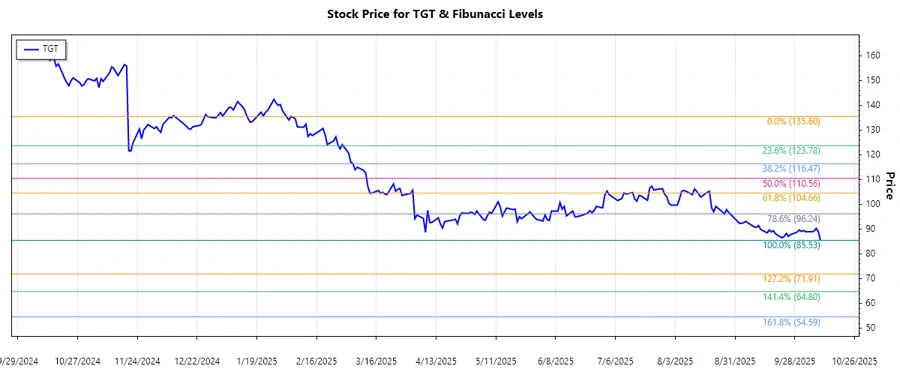
Target Corporation, trading under the ticker symbol TGT, operates as a major retailer in the United States market. The company is known for its diverse product assortment, spanning essentials, apparel, home goods, and various seasonal items. Recently, the stock has been in a substantial downtrend, moving from highs in early 2025 to noticeable lows by October 2025, potentially providing an opportunity for recovery or further decline as market conditions evolve.
Fibonacci Analysis
The analyzed period reflects a significant downtrend for Target Corporation. Identifying the major peak and trough in this trend allows us to calculate the potential Fibonacci retracement levels, providing insights into possible price support or resistance levels.
| Parameter | Value |
|---|---|
| Start Date | 2025-02-11 |
| End Date | 2025-10-10 |
| High Price | $135.60 (2025-02-11) |
| Low Price | $85.53 (2025-10-10) |
| Fibonacci 0.236 | $97.414 |
| Fibonacci 0.382 | $103.936 |
| Fibonacci 0.5 | $110.565 |
| Fibonacci 0.618 | $117.194 |
| Fibonacci 0.786 | $126.115 |
| Current Price Retracement Zone | Below 0.236 |
The current price remains below the 0.236 Fibonacci level, indicating that it hasn't retraced significantly from its recent lows. This suggests the potential for the price to seek support at lower levels or consolidate before any meaningful uptrend.
Conclusion
Target Corporation's stock has faced substantial downward pressure over the analyzed period. Despite this, the calculated Fibonacci retracement levels suggest potential resistance points up to $126.115. Current market positioning below the 0.236 level underscores potential weakness or the need for strong catalysts for reversal. Analysts should watch for fundamental changes in Target's business model or broader economic recovery indicators to better assess recovery potential against new resistance levels.