July 17, 2025 a 06:44 am
TGT: Fibonacci Analysis - Target Corporation
Target Corporation, a leading general merchandise retailer, has demonstrated significant price movements over recent months. With a wide array of products spanning food, apparel, electronics, and more, Target continues to adapt to the dynamic retail landscape amidst growing online sales and in-store experience offerings. Investors should be mindful of the potential volatility in the stock amidst economic fluctuations and consumer sentiment, but opportunities remain for gains in a stable growth phase.
Fibonacci Analysis
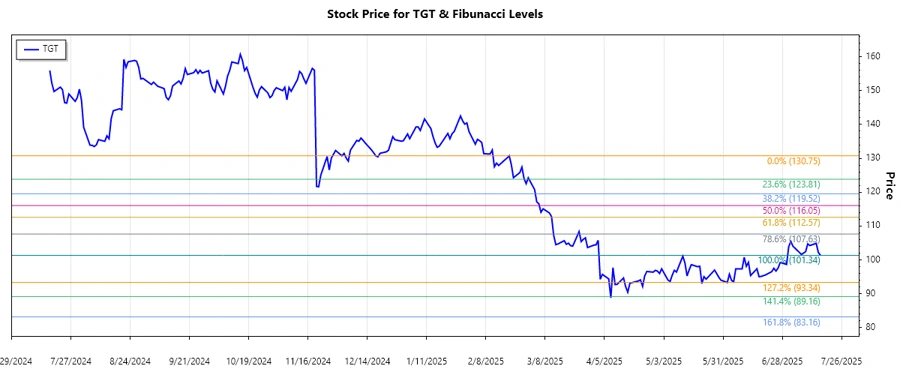
Based on the historical data, the stock has experienced a dominant downward trend. The analysis identifies a trend from February 19, 2025, to July 16, 2025. Using the highest and lowest points during this timeframe, we have calculated the Fibonacci retracement levels to understand potential support and resistance levels.
| Trend Period | High Date | High Price | Low Date | Low Price | Current Price |
|---|---|---|---|---|---|
| 2025-02-19 to 2025-07-16 | 2025-02-19 | $130.75 | 2025-07-16 | $101.34 | $101.34 |
| Fibonacci Level | Price Level |
|---|---|
| 0.236 | $106.50 |
| 0.382 | $109.98 |
| 0.5 | $114.05 |
| 0.618 | $118.12 |
| 0.786 | $122.50 |
The current price of $101.34 indicates the stock is outside the retracement zones, suggesting it has potential room for correction upward, with the next major resistance at the 0.236 level. This provides technical insight into possible support areas should the stock begin to rebound.
This analysis suggests potential resistance near $106.50, with the deeper retracement levels offering stronger resistance if a reversal trend establishes momentum.
Conclusion
The Target Corporation (TGT) stock has experienced pronounced downward pressure from February to July 2025. This downtrend has been reflected in the broader market adjustments and consumer spending patterns. Technical indicators, such as the Fibonacci retracement levels, highlight potential resistance zones should the stock price attempt recovery. While the current rate is below the lower 0.236 retracement, indicating further downside risk, strategic opportunities for gradual accumulation exist for investors focused on long-term growth. Potential risks, including macroeconomic influences and retail market shifts, need consideration for informed investment decisions.
Smart Data Insight
Master the Perfect Entry & Exit for this Stock
Don't leave your profits to chance. Historically, this stock follows specific seasonal patterns that institutional traders use to maximize returns.
- ✅ Identify the "Golden Buying Window"
- ✅ Avoid high-risk correction cycles
- ✅ Backtested data from the last 20+ years