
July 13, 2026 a 03:31 am


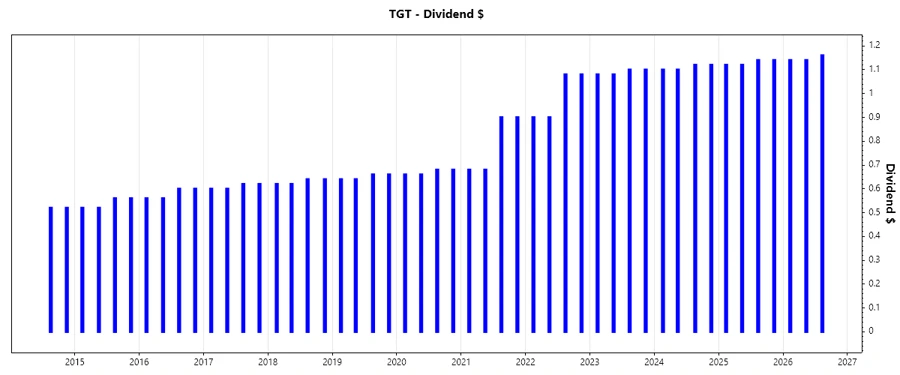

TGT: Dividend Analysis - Target Corporation
Target Corporation (TGT) exhibits a strong dividend profile with consistent increases over 44 years, signaling stability and reliability in income distribution. The company's current dividend yield of 3.39% is attractive, particularly in a low-interest-rate environment. With a 5-year dividend growth rate of 11%, Target demonstrates a commitment to returning capital to shareholders. The payout ratios based on EPS and free cash flow are manageable, suggesting the dividends are sustainable. Target's financial performance, with strong key ratios, further enhances its status as a solid dividend-paying stock.
Overview 📊
Target Corporation operates in the retail sector, offering a dividend yield of 3.39% with a current dividend of 4.52 USD per share. The firm has maintained dividend increases for 44 consecutive years, showcasing its commitment to shareholder returns. The absence of any recent dividend cuts or suspensions underscores this commitment.
| Data | Details |
|---|---|
| Sector | Retail |
| Dividend Yield | 3.39% |
| Current Dividend per Share | 4.52 USD |
| Dividend History | 44 years |
| Last Cut/Suspension | None |
Dividend History 🗣️
Analyzing the dividend history is crucial as it reflects the company's earnings stability and management's commitment to distributing profits to shareholders. A strong history suggests reliability in income generation.
| Year | Dividend per Share (USD) |
|---|---|
| 2026 | 3.44 |
| 2025 | 4.52 |
| 2024 | 4.44 |
| 2023 | 4.36 |
| 2022 | 3.96 |
Dividend Growth 📈
Dividend growth is vital as it indicates the company's capacity to increase shareholder returns. Consistent growth reflects positively on management's confidence in future cash flows.
| Time | Growth |
|---|---|
| 3 years | 4.51% |
| 5 years | 11.02% |
The average dividend growth is 11.02% over 5 years. This shows moderate but steady dividend growth.
Payout Ratio ✅
The payout ratio is significant as it measures the proportion of earnings paid out as dividends. It indicates the sustainability of the dividends.
| Key Figure | Ratio |
|---|---|
| EPS-based | 59.47% |
| Free cash flow-based | 65.69% |
With an EPS payout ratio of 59.47% and an FCF payout ratio of 65.69%, Target maintains a healthy balance between returning income to shareholders and reinvesting in the business.
Cashflow & Capital Efficiency 💰
The cash flow and capital efficiency ratios reveal the efficiency with which a company generates cash and its ability to fund operations, growth, and dividends.
| Metric | 2023 | 2024 | 2025 |
|---|---|---|---|
| Free Cash Flow Yield | 5.68% | 7.05% | 5.92% |
| Earnings Yield | 6.16% | 6.44% | 7.74% |
| CAPEX to Operating Cash Flow | 55.75% | 39.24% | 56.80% |
| Stock-based Compensation to Revenue | 0.23% | 0.29% | 0.26% |
| Free Cash Flow / Operating Cash Flow Ratio | 44.25% | 60.76% | 43.20% |
| ROIC (Return on Invested Capital) | 11.89% | 11.10% | 9.76% |
These metrics indicate that Target is effectively managing its capital to ensure the sustainability of its dividend payments and operational efficiency.
Balance Sheet & Leverage Analysis 🚀
Analyzing balance sheet metrics and leverage ratios offers insight into financial stability, risk, and liquidity. A robust balance sheet underpins stable dividend payments.
| Metric | 2023 | 2024 | 2025 |
|---|---|---|---|
| Debt-to-Equity | 146.26% | 135.52% | 125.52% |
| Debt-to-Assets | 35.49% | 34.40% | 34.11% |
| Debt-to-Capital | 59.39% | 57.54% | 55.66% |
| Net Debt to EBITDA | 1.84 | 1.75 | 1.77 |
| Current Ratio | 0.91 | 0.94 | 0.94 |
| Quick Ratio | 0.29 | 0.32 | 0.36 |
| Financial Leverage | 4.12 | 3.94 | 3.68 |
Target's strong debt-management policies and liquidity ratios indicate prudent financial governance and support continued dividend payouts.
Fundamental Strength & Profitability 🔍
Performance indicators such as returns and margins reveal the company's profitability and operational efficiency, key drivers for long-term dividend sustainability.
| Metric | 2023 | 2024 | 2025 |
|---|---|---|---|
| Return on Equity | 30.81% | 27.89% | 22.92% |
| Return on Assets | 7.48% | 7.08% | 6.23% |
| Net Margin | 3.85% | 3.84% | 3.54% |
| Gross Margin | 27.54% | 28.21% | 27.93% |
| EBIT Margin | 5.40% | 5.32% | 4.97% |
| EBITDA Margin | 8.01% | 8.12% | 7.97% |
| R&D to Revenue | 0% | 0% | 0% |
With consistently strong profitability metrics, Target displays robust operational strength conducive to maintaining its dividend program.
Price Development 📉
Dividend Scoring System 🏆
| Category | Rating | Score |
|---|---|---|
| Dividend Yield | 4/5 | |
| Dividend Stability | 5/5 | |
| Dividend Growth | 4/5 | |
| Payout Ratio | 4/5 | |
| Financial Stability | 5/5 | |
| Dividend Continuity | 5/5 | |
| Cashflow Coverage | 3/5 | |
| Balance Sheet Quality | 4/5 |
Total Score: 34/40
Rating ⭐
Target Corporation presents a compelling dividend profile with well-balanced financial metrics, strong dividend history, and growth potential. Its sustainable payout ratios and robust financial governance make it a viable and attractive investment for dividend-focused investors.
Smart Data Insight
Master the Perfect Entry & Exit for this Stock
Don't leave your profits to chance. Historically, this stock follows specific seasonal patterns that institutional traders use to maximize returns.
- ✅ Identify the "Golden Buying Window"
- ✅ Avoid high-risk correction cycles
- ✅ Backtested data from the last 20+ years