May 06, 2026 a 11:31 am

TGT: Dividend Analysis - Target Corporation
Target Corporation, known for its strong consumer retail presence, offers a stable dividend history with consistent payouts over the years. The current dividend yield of approximately 3.54% reflects its commitment to returning value to shareholders. With over four decades of dividend payouts, Target Corporation exemplifies a reliable income-generating investment choice.
📊 Overview
As a leading entity in the Consumer Discretionary sector, Target Corporation showcases a robust dividend profile.
| Metric | Data |
|---|---|
| Sector | Consumer Discretionary |
| Dividend Yield | 3.54% |
| Current Dividend Per Share | 4.52 USD |
| Dividend History | 44 years |
| Last Cut or Suspension | None |
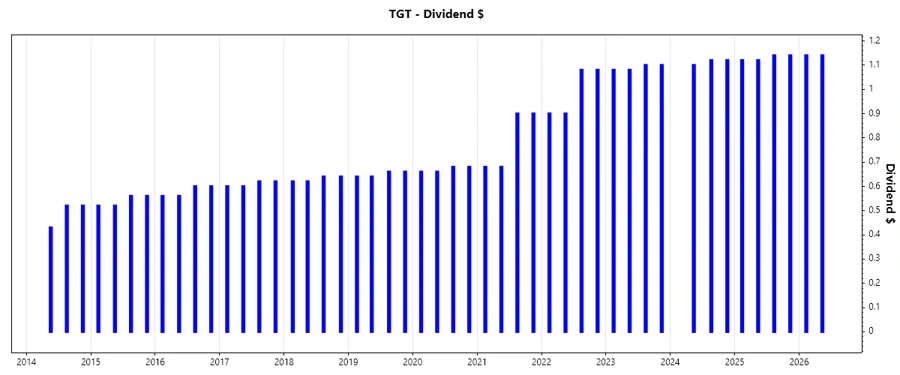
📈 Dividend History
The history of consistent dividend payouts is crucial for assessing a company's financial health and shareholder return potential.
| Year | Dividend Per Share (USD) |
|---|---|
| 2026 | 2.28 |
| 2025 | 4.52 |
| 2024 | 3.34 |
| 2023 | 4.36 |
| 2022 | 3.96 |
📉 Dividend Growth
Dividend growth is an essential indicator of a company's long-term profitability and commitment to increasing shareholder value.
| Time | Growth |
|---|---|
| 3 years | 4.51% |
| 5 years | 11.02% |
The average dividend growth is 11.02% over 5 years. This shows moderate but steady dividend growth.
✅ Payout Ratio
The payout ratio assists in determining the proportion of earnings distributed as dividends, reflecting sustainability.
| Key Figure | Ratio |
|---|---|
| EPS-based | 55.28% |
| Free Cash Flow-based | 69.88% |
With a payout ratio of 55.28% (EPS) and 69.88% (FCF), Target Corporation maintains a balanced dividend policy, supporting both reinvestment and shareholder distribution.
📈 Cashflow & Capital Efficiency
Understanding cash flow dynamics and capital efficiency is essential for evaluating a company’s operational effectiveness and investment attractiveness.
| Metric | 2025 | 2024 | 2023 |
|---|---|---|---|
| Free Cash Flow Yield | 5.92% | 7.05% | 5.68% |
| Earnings Yield | 7.74% | 6.44% | 6.16% |
| CAPEX to Operating Cash Flow | 55.35% | 39.24% | 55.75% |
| Stock-based Compensation to Revenue | 0.27% | 0.29% | 0.23% |
| Free Cash Flow / Operating Cash Flow Ratio | 43.20% | 60.76% | 44.25% |
The metrics exhibit Target Corporation’s effective cash management and capital deployment strategy, underscoring solid cashflow stability.
🗣️ Balance Sheet & Leverage Analysis
An assessment of balance sheet strength and leverage positions provides insights into financial resilience and risk exposure.
| Metric | 2025 | 2024 | 2023 |
|---|---|---|---|
| Debt-to-Equity | 125.52% | 135.52% | 146.26% |
| Debt-to-Assets | 34.11% | 34.40% | 35.49% |
| Debt-to-Capital | 55.66% | 57.54% | 59.39% |
| Net Debt to EBITDA | 1.77 | 1.75 | 1.84 |
| Current Ratio | 0.94 | — | — |
| Quick Ratio | 0.36 | — | — |
| Financial Leverage | 3.68 | — | — |
Target’s leverage metrics reveal manageable debt levels and robust liquidity, supporting sustainability in financial obligations.
✅ Fundamental Strength & Profitability
Analyzing profitability and fundamental metrics entails discerning a company's efficiency in generating profits relative to its resources and operations.
| Metric | 2025 | 2024 | 2023 |
|---|---|---|---|
| Return on Equity | 22.92% | 27.89% | 30.81% |
| Return on Assets | 6.23% | 7.08% | 7.48% |
| Net Profit Margin | 3.54% | 3.84% | 3.85% |
| Gross Profit Margin | 27.93% | 28.21% | 27.54% |
| EBIT Margin | 4.97% | 5.32% | 5.40% |
| EBITDA Margin | 7.97% | 8.12% | 8.01% |
| Research & Development to Revenue | 0% | 0% | 0% |
Target Corporation’s profitability metrics suggest efficient resource utilization, contributing to sustained financial performance.
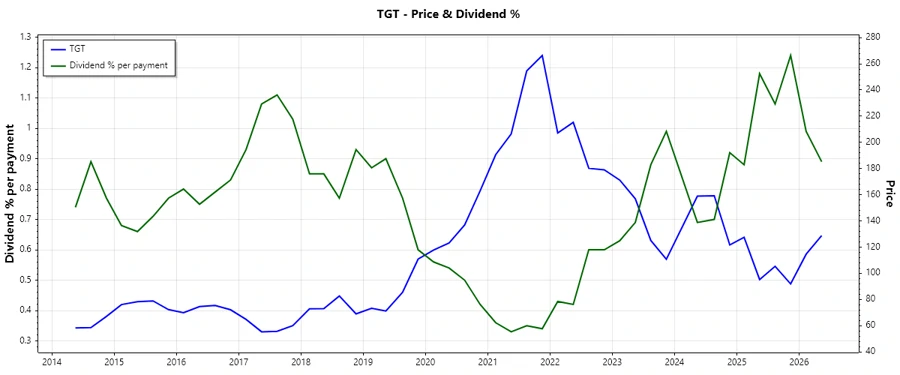
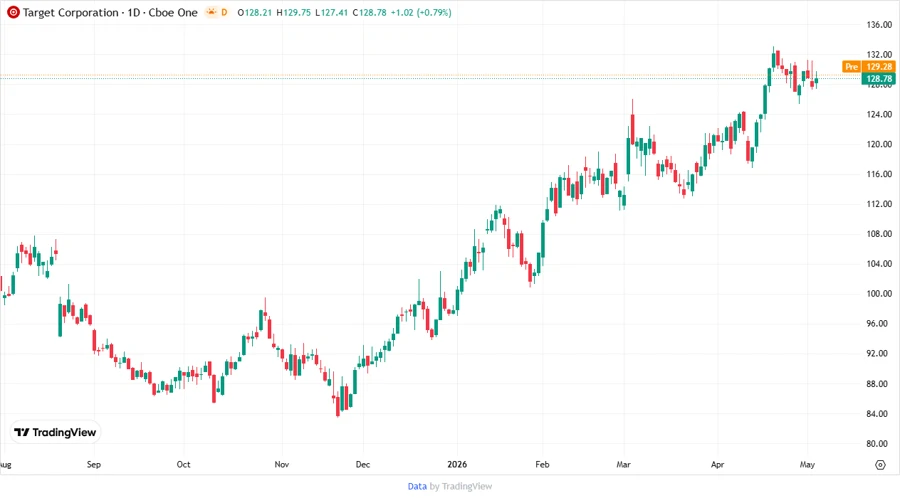
📉 Price Development
✅ Dividend Scoring System
| Criteria | Score | Progress |
|---|---|---|
| Dividend Yield | 4 | |
| Dividend Stability | 5 | |
| Dividend Growth | 3 | |
| Payout Ratio | 4 | |
| Financial Stability | 4 | |
| Dividend Continuity | 5 | |
| Cashflow Coverage | 3 | |
| Balance Sheet Quality | 4 |
Total Score: 32/40
🗣️ Rating
Target Corporation provides a compelling dividend profile with strong stability and fair growth trajectory. Recommended for income-focused portfolios valuing reliability and consistent returns.
Smart Data Insight
Master the Perfect Entry & Exit for this Stock
Don't leave your profits to chance. Historically, this stock follows specific seasonal patterns that institutional traders use to maximize returns.
- ✅ Identify the "Golden Buying Window"
- ✅ Avoid high-risk correction cycles
- ✅ Backtested data from the last 20+ years