November 21, 2025 a 03:31 pm
TGT: Dividend Analysis - Target Corporation
The dividend analysis for Target Corporation demonstrates a robust and consistent dividend history, supported by solid financial foundations. With a commendable track record of raising dividends and maintaining a healthy payout ratio, Target Corporation stands out as an attractive option for income-focused investors. The transparency of its capital allocation highlights a long-term commitment to shareholder value.
📊 Overview
Target Corporation is part of the Retail sector, showing a consistent dividend strategy over the years. The company boasts an impressive dividend history of 43 years without any significant cuts, solidifying its reputation among dividend investors.
| Metric | Details |
|---|---|
| Sector | Retail |
| Dividend Yield | 4.91% |
| Current Dividend per Share | 4.44 USD |
| Dividend History | 43 years |
| Last Cut/Suspension | None |
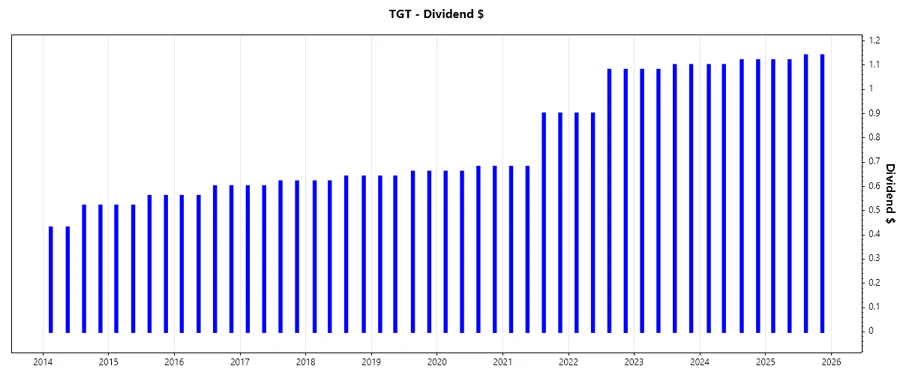
🗣️ Dividend History
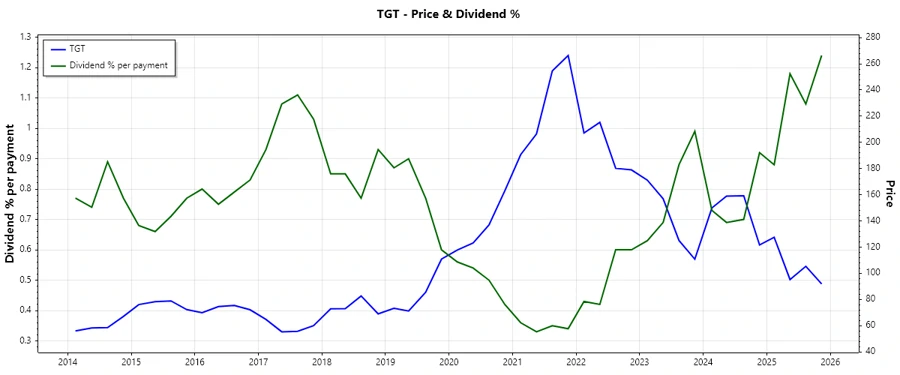
The historical stability of Target’s dividends underlines its reliability as an income-generating investment. Consistent dividend payments reflect the company's robust financial health and strategic focus on shareholder returns.
| Year | Dividend per Share (USD) |
|---|---|
| 2025 | 4.52 |
| 2024 | 4.44 |
| 2023 | 4.36 |
| 2022 | 3.96 |
| 2021 | 3.16 |
📈 Dividend Growth
Steady dividend growth over the years is indicative of a company's expanding earnings and increasing financial strength, which is essential for sustaining long-term shareholder returns. Target's progressive increase in dividends reflects effective management and a focus on returning value to shareholders.
| Timeframe | Growth |
|---|---|
| 3 years | 12.00% |
| 5 years | 11.30% |
The average dividend growth is 11.30% over 5 years. This shows moderate but steady dividend growth, suggesting a company that is both financially healthy and committed to enhancing shareholder value.
✅ Payout Ratio
The payout ratio provides insights into how well earnings support the dividend payments, ensuring they are sustainable and not over-leveraged. Target’s prudent management of payout ratios enhances confidence among its stakeholders.
| Metric | Percentage |
|---|---|
| EPS-based | 49.92% |
| Free cash flow-based | 36.51% |
The EPS-based payout ratio of 49.92% and FCF-based ratio of 36.51% signify a balanced approach, offering room for reinvestment in growth while rewarding shareholders. The healthy payout ratios indicate prudent financial management.
📉 Cashflow & Capital Efficiency
This assessment investigates how efficiently a company generates cash to cover its dividends and other obligations, reflecting its operational effectiveness and financial discipline. Capital efficiency metrics are critical to evaluate sustainability and long-term profitability.
| Metric | 2022 | 2023 | 2024 |
|---|---|---|---|
| Free Cash Flow Yield | -1.9% | 5.94% | 7.05% |
| Earnings Yield | 3.49% | 6.45% | 6.44% |
| CAPEX to Operating Cash Flow | 137.58% | 55.75% | 39.24% |
| Stock-based Compensation to Revenue | 0.2% | 0.2% | 0.3% |
| Free Cash Flow / Operating Cash Flow Ratio | -37.58% | 44.25% | 60.75% |
Target’s increasing free cash flow yield and disciplined CAPEX allocation reflect robust operational management and a strong commitment to capital efficiency, ensuring sustained dividends and shareholder value.
📊 Balance Sheet & Leverage Analysis
This analysis focuses on a company's capital structure and its ability to meet its long-term obligations, crucial for assessing long-term financial stability. Balanced leverage ratios support financial flexibility, crucial for unpredictable economic conditions.
| Metric | 2022 | 2023 | 2024 |
|---|---|---|---|
| Debt-to-Equity | 169.81% | 146.26% | 135.52% |
| Debt-to-Assets | 35.76% | 35.49% | 34.40% |
| Debt-to-Capital | 62.94% | 59.39% | 57.54% |
| Net Debt to EBITDA | 2.55 | 1.84 | 2.19 |
| Current Ratio | 0.92 | 0.91 | 0.94 |
| Quick Ratio | 0.22 | 0.29 | 0.32 |
| Financial Leverage | 4.75 | 4.12 | 3.94 |
Target’s improving leverage ratios and solid current and quick ratios emphasize strong financial resilience, aiding in its capacity to sustain its dividend payouts and associated obligations over time.
📡 Fundamental Strength & Profitability
A comprehensive analysis of key profitability metrics and company fundamentals, showcasing the ability to consistently generate returns from its investments. Strong margin indicators reflect a company’s competitive advantage within the industry.
| Metric | 2022 | 2023 | 2024 |
|---|---|---|---|
| Return on Equity | 24.75% | 30.81% | 27.89% |
| Return on Assets | 5.21% | 7.48% | 7.08% |
| Gross Margin | 22.46% | 25.38% | 25.84% |
| EBITDA Margin | 6.05% | 8.03% | 8.14% |
| R&D to Revenue | 0% | 0% | 0% |
| EBIT Margin | 3.57% | 5.42% | 5.34% |
The steady performance in profit margins and returns on equity and assets underline Target’s operational excellence and strategic market positioning, reinforcing its foundational strength and sustained profitability.
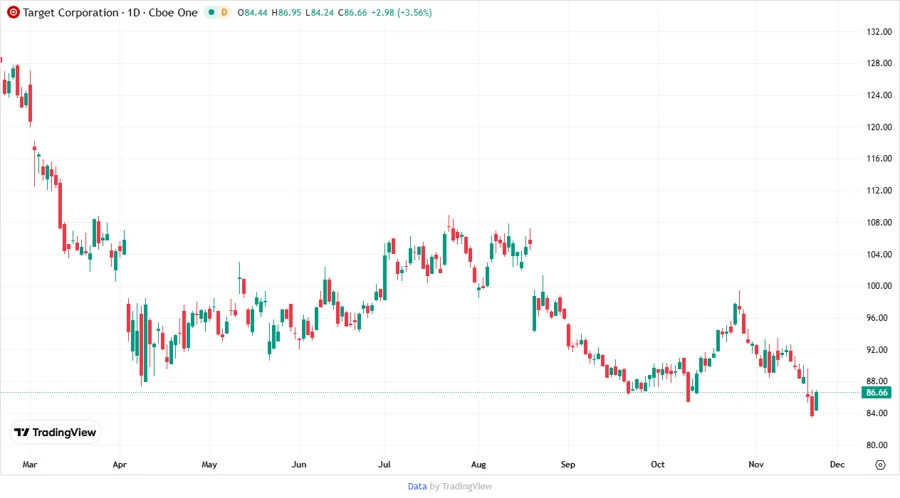
📈 Price Development
💼 Dividend Scoring System
Target’s dividend scoring involves a holistic examination of its payout policies and financial indicators, crucial for potential investors evaluating dividend sustainability and attractiveness.
| Category | Score | Bar |
|---|---|---|
| Dividend yield | 4 | |
| Dividend Stability | 5 | |
| Dividend growth | 3 | |
| Payout ratio | 4 | |
| Financial stability | 4 | |
| Dividend continuity | 5 | |
| Cashflow Coverage | 4 | |
| Balance Sheet Quality | 3 |
Total Score: 32/40
🏆 Rating
In conclusion, Target Corporation presents a solid investment case for dividend-focused investors, marked by long-standing dividend reliability and promising growth prospects. The company’s financial fortitude further enhances its profile, suggesting a commendable balance between rewarding shareholders and underpinning future growth. This analysis supports a positive outlook, recommending Target as a prudent choice for a well-rounded dividend portfolio.