November 05, 2025 a 03:31 pm
TGT: Dividend Analysis - Target Corporation
The dividend analysis for Target Corporation reveals a robust dividend yield of 5.02%, with 43 consecutive years of increasing dividends, indicating a strong commitment to returning value to shareholders. However, a careful examination of its payout ratios and growth trends is necessary to gauge sustainability and future growth prospects.
📊 Overview
Target Corporation's performance in the consumer sector demonstrates a resilient dividend profile. The company has shown an impressive 43-year history of uninterrupted dividend increases.
| Criteria | Details |
|---|---|
| Sector | Consumer |
| Dividend Yield | 5.02 % |
| Current Dividend per Share | 4.44 USD |
| Dividend History | 43 years |
| Last Cut or Suspension | None |
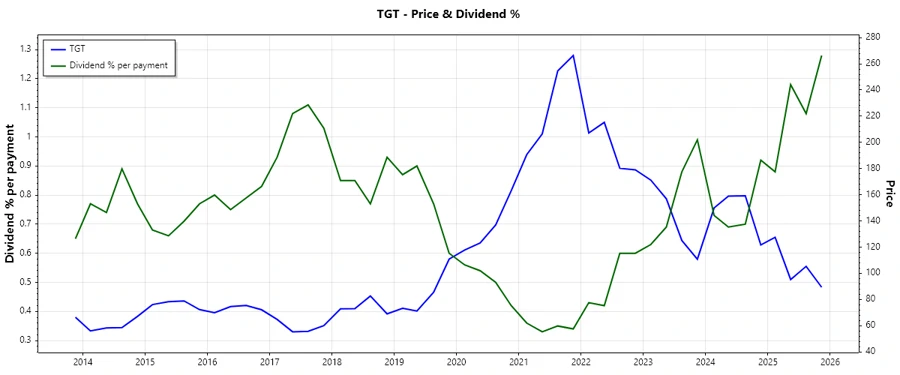
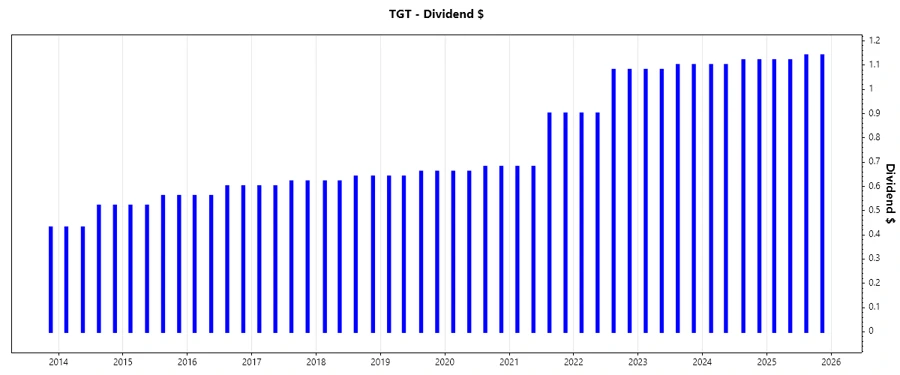
📈 Dividend History
Analyzing the dividend history provides insights into the company's dedication to maintaining and increasing shareholder returns. Target's 43-year streak of dividend increases is a strong indicator of stability.
| Year | Dividend per Share (USD) |
|---|---|
| 2025 | 4.52 |
| 2024 | 4.44 |
| 2023 | 4.36 |
| 2022 | 3.96 |
| 2021 | 3.16 |
📉 Dividend Growth
Aggregate growth rates highlight Target's ability to increase dividends over the past 3 and 5 years. The company's commitment to growth is demonstrated by its consistent dividend escalations.
| Time | Growth |
|---|---|
| 3 years | 12.00 % |
| 5 years | 11.30 % |
The average dividend growth is 11.30% over 5 years, indicating moderate but steady growth.
🗣️ Payout Ratio
The payout ratio is a vital measure of dividend sustainability. With an EPS-based payout ratio of 51.43% and a free cash flow-based payout ratio of 42.00%, Target maintains a healthy balance between dividend payments and reinvestment in its operations.
| Key Figure | Ratio |
|---|---|
| EPS-based | 51.43 % |
| Free Cash Flow-based | 42.00 % |
The EPS and FCF payout ratios suggest a conservative approach, balancing dividend payouts with operational funding needs.
📊 Cashflow & Capital Efficiency
Analyzing cash flow and capital efficiency ratios helps to gauge the company's financial health and its ability to generate cash relative to its income.
| Metric | 2024 | 2023 | 2022 |
|---|---|---|---|
| Free Cash Flow Yield | 7.05 % | 5.94 % | -1.90 % |
| Earnings Yield | 6.44 % | 6.45 % | 3.49 % |
| CAPEX to Operating Cash Flow | 39.24 % | 55.75 % | 137.58 % |
| Stock-based Compensation to Revenue | 0.29 % | 0.23 % | 0.20 % |
| Free Cash Flow / Operating Cash Flow Ratio | 60.76 % | 44.25 % | -37.58 % |
With consistent cash generation capabilities and sound capital investments, Target showcases efficient capital management.
🔍 Balance Sheet & Leverage Analysis
Understanding leverage and liquidity profiles is essential to assess financial stability. Target has maintained a healthy current and quick ratio over the past years, alongside manageable debt levels.
| Metric | 2024 | 2023 | 2022 |
|---|---|---|---|
| Debt-to-Equity | 1.36 | 1.46 | 1.70 |
| Debt-to-Assets | 0.34 | 0.35 | 0.36 |
| Debt-to-Capital | 0.58 | 0.59 | 0.63 |
| Net Debt to EBITDA | 2.19 | 1.84 | 2.55 |
| Current Ratio | 0.94 | 0.91 | 0.92 |
| Quick Ratio | 0.32 | 0.29 | 0.22 |
| Financial Leverage | 3.94 | 4.12 | 4.75 |
Target's debt profile suggests a cautious approach to leveraging, maintaining liquidity despite moderate debt levels.
💡 Fundamental Strength & Profitability
Profitability ratios such as ROE, ROA, and margins are crucial indicators of a firm’s operational efficiency.
| Metric | 2024 | 2023 | 2022 |
|---|---|---|---|
| Return on Equity | 27.89 % | 30.81 % | 24.75 % |
| Return on Assets | 7.08 % | 7.48 % | 5.21 % |
| Net Margin | 3.84 % | 3.85 % | 2.55 % |
| EBIT Margin | 5.34 % | 5.42 % | 3.57 % |
| EBITDA Margin | 8.14 % | 8.03 % | 6.05 % |
| Gross Margin | 25.84 % | 25.38 % | 22.46 % |
| R&D to Revenue | 0.00 % | 0.00 % | 0.00 % |
High ROE and ROA figures reflect Target's efficient use of equity and assets to generate profit, reinforcing its fundamental strength.
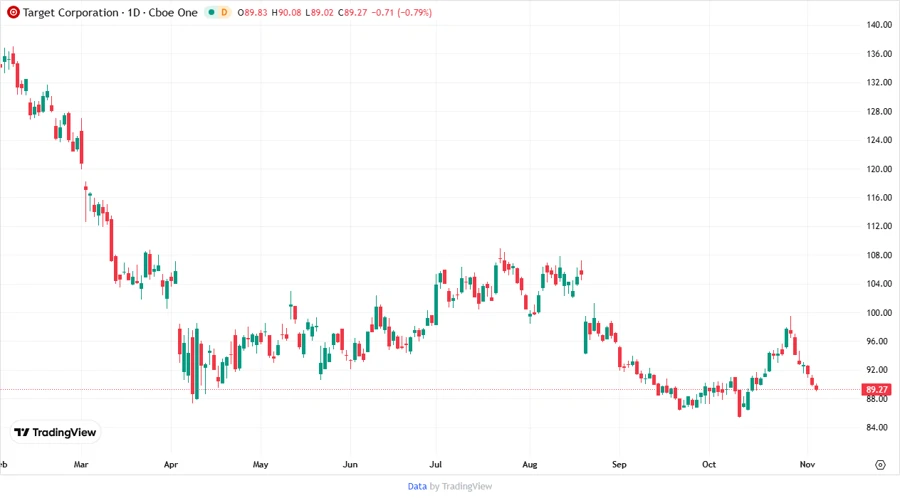
📉 Price Development
👥 Dividend Scoring System
This scoring system evaluates key aspects of Target's dividend policy.
| Category | Description | Score |
|---|---|---|
| Dividend Yield | High yield relative to peers | 4/5 |
| Dividend Stability | 43 years of consecutive increases | 5/5 |
| Dividend Growth | Consistent growth pattern | 4/5 |
| Payout Ratio | Balanced and sustainable | 4/5 |
| Financial Stability | Sound balance sheet | 4/5 |
| Dividend Continuity | No cuts or suspensions | 5/5 |
| Cashflow Coverage | Strong cash generation | 4/5 |
| Balance Sheet Quality | Well-managed leverage | 4/5 |
Score: 34/40
✅ Rating
Target Corporation exhibits a robust dividend profile with sustained growth, making it a commendable choice for dividend-focused portfolios. The company's historical commitment to increasing shareholder returns and prudent financial management underpins its appeal. Therefore, Target is recommended as a BUY for dividend-seeking investors.
Smart Data Insight
Master the Perfect Entry & Exit for this Stock
Don't leave your profits to chance. Historically, this stock follows specific seasonal patterns that institutional traders use to maximize returns.
- ✅ Identify the "Golden Buying Window"
- ✅ Avoid high-risk correction cycles
- ✅ Backtested data from the last 20+ years