September 27, 2025 a 07:32 am
TGT: Dividend Analysis - Target Corporation
Target Corporation is renowned for its consistent and solid dividend history. With an extensive span of uninterrupted dividend payments, potential investors can expect continued payouts. However, it is imperative to consider current market conditions and Target's financial health before making any investment decision.
📊 Overview
Target Corporation, operating in the retail sector, offers a lucrative dividend yield of 5.15%, reflecting its commitment to returning value to shareholders. With a 43-year history of dividend payments and no recent cuts or suspensions, Target stands out for its dividend reliability.
| Metric | Value |
|---|---|
| Sector | Retail |
| Dividend yield | 5.15% |
| Current dividend per share | $4.44 |
| Dividend history | 43 years |
| Last cut or suspension | None |
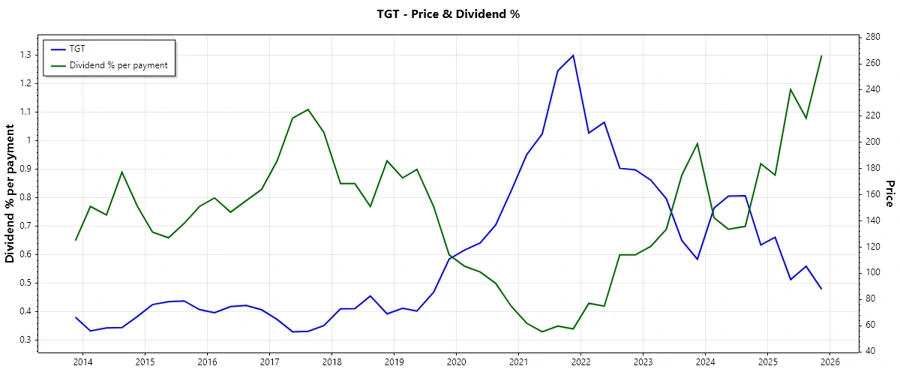
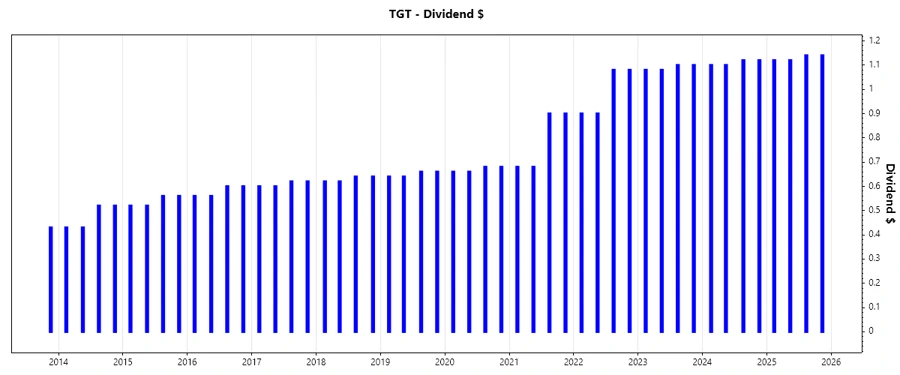
🗣️ Dividend History
Target Corporation's dividend history underlines its strong shareholder commitment and financial resilience. A long uninterrupted history signifies stakeholder trust and a robust financial identity.
| Year | Dividend per Share (USD) |
|---|---|
| 2025 | 4.52 |
| 2024 | 4.44 |
| 2023 | 4.36 |
| 2022 | 3.96 |
| 2021 | 3.16 |
📈 Dividend Growth
Dividend growth over three and five years provides insight into a company's future payout capabilities. Stable growth often indicates fiscal health and reliable cash flows.
| Time | Growth |
|---|---|
| 3 years | 12.00% |
| 5 years | 11.30% |
The average dividend growth is 11.30% over 5 years. This shows moderate but steady dividend growth.
⚠️ Payout Ratio
Payout ratios highlight the proportion of earnings and cash flow dedicated to dividends. A sustainable payout ratio ensures the company can maintain dividends without financial distress.
| Key Figure Ratio | Percentage |
|---|---|
| EPS-based | 51.45% |
| Free cash flow-based | 42.00% |
The payout ratios indicate a balanced approach, with 51.45% based on EPS and a conservative 42.00% based on free cash flow, showing healthy coverage.
✅ Cashflow & Capital Efficiency
Understanding the efficiency of cash usage and capital allocation is crucial for assessing a company's ability to sustain dividends and grow organically.
| Metric | 2026 | 2025 | 2024 |
|---|---|---|---|
| Free Cash Flow Yield | 7.05% | 5.68% | -1.94% |
| Earnings Yield | 6.44% | 6.16% | 3.57% |
| CAPEX to Operating Cash Flow | 39.24% | 55.75% | 137.58% |
| Stock-based Compensation to Revenue | 0.29% | 0.23% | 0.20% |
| Free Cash Flow / Operating Cash Flow Ratio | 60.76% | 44.25% | -37.58% |
The cash flow and capital efficiency metrics reveal a generally strong position, although there is room for improvement in terms of free cash flow performance.
⚖️ Balance Sheet & Leverage Analysis
A robust balance sheet with manageable leverage is vital for sustaining operations, funding growth, and paying dividends under varied economic conditions.
| Metric | 2026 | 2025 | 2024 |
|---|---|---|---|
| Debt-to-Equity | 1.36 | 1.46 | 1.70 |
| Debt-to-Assets | 0.34 | 0.35 | 0.36 |
| Debt-to-Capital | 0.58 | 0.59 | 0.63 |
| Net Debt to EBITDA | 1.74 | 1.84 | 2.55 |
| Current Ratio | 0.94 | 0.91 | 0.92 |
| Quick Ratio | 0.32 | 0.29 | 0.22 |
| Financial Leverage | 3.94 | 4.12 | 4.75 |
The company maintains a healthy leverage position with an improved financial structure over recent years, indicating effective management of debt levels.
🌟 Fundamental Strength & Profitability
Examining fundamental strength through profitability metrics gives insights into a company's ability to generate profit relative to its revenue and equity use.
| Metric | 2026 | 2025 | 2024 |
|---|---|---|---|
| Return on Equity | 27.89% | 30.81% | 24.75% |
| Return on Assets | 7.08% | 7.48% | 5.21% |
| Net Margin | 3.84% | 3.85% | 2.55% |
| EBIT Margin | 5.34% | 5.42% | 3.57% |
| EBITDA Margin | 8.14% | 8.03% | 6.05% |
| Gross Margin | 25.84% | 25.38% | 22.46% |
| R&D to Revenue | 0.00% | 0.00% | 0.00% |
Target's profitability metrics indicate strong operational efficiency, although the recent dip in net margin warrants caution moving forward.
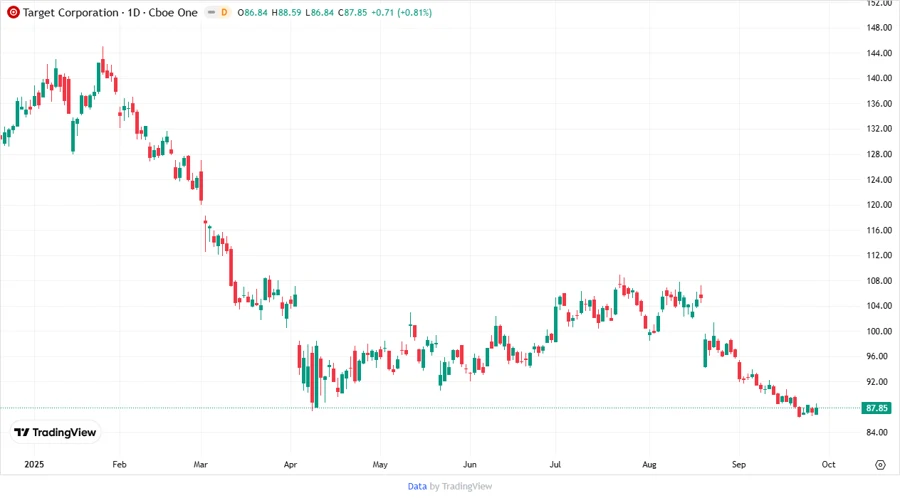
🛒 Price Development
🎯 Dividend Scoring System
| Category | Score | |
|---|---|---|
| Dividend Yield | 5 | |
| Dividend Stability | 5 | |
| Dividend Growth | 4 | |
| Payout Ratio | 4 | |
| Financial Stability | 3 | |
| Dividend Continuity | 5 | |
| Cashflow Coverage | 3 | |
| Balance Sheet Quality | 4 |
Total Score: 33/40
⭐ Rating
Based on the analysis, Target Corporation's current dividend profile suggests a strong investment with a reliable payout history. It's an attractive option for dividend-focused investors, although one should monitor financial updates to ensure these positive trends continue.
Smart Data Insight
Master the Perfect Entry & Exit for this Stock
Don't leave your profits to chance. Historically, this stock follows specific seasonal patterns that institutional traders use to maximize returns.
- ✅ Identify the "Golden Buying Window"
- ✅ Avoid high-risk correction cycles
- ✅ Backtested data from the last 20+ years