August 16, 2025 a 03:32 am


TGT: Dividend Analysis - Target Corporation
Target Corporation presents a resilient dividend profile characterized by a strong history of sustained payments. With over four decades of uninterrupted dividend history, the stability and reliability of TGT's dividends are notable attributes for long-term investors. The current dividend yield remains competitive within the retail sector.
Overview 📊
As a prominent entity in the retail sector, Target Corporation exhibits a commendable dividend yield of 4.27%. The current dividend per share amounts to $4.44, reflecting a solid commitment to shareholder returns, with an impressive 43 years of dividend history. Notably, there have been no recent cuts or suspensions in their dividend schedule.
| Metric | Value |
|---|---|
| Sector | Retail |
| Dividend Yield | 4.27 % |
| Current Dividend per Share | $4.44 |
| Dividend History | 43 years |
| Last Cut or Suspension | None |
Dividend History 📈
Target’s extensive dividend history underscores its consistent financial strategies, making it a reliable choice for income-focused investors. Understanding historic dividend payouts is vital for assessing future dividend potential.
| Year | Dividend per Share (USD) |
|---|---|
| 2025 | $3.38 |
| 2024 | $4.44 |
| 2023 | $4.36 |
| 2022 | $3.96 |
| 2021 | $3.16 |
Dividend Growth 📉
The modest dividend growth rate of 12.00% over the past three years and 11.29% across five years indicates a focused yet steady increase, demonstrating management's commitment to enhancing shareholder value.
| Time | Growth |
|---|---|
| 3 years | 12.00 % |
| 5 years | 11.29 % |
The average dividend growth is 11.29% over 5 years. This shows moderate but steady dividend growth, making it appealing for long-term equity holders.
Payout Ratio 🗣️
The payout ratios for EPS and Free Cash Flow are key indicators of dividend sustainability. With an EPS payout ratio of 48.32% and an FCF payout ratio of 57.14%, Target Corporation maintains a balanced approach, ensuring dividend commitments are well covered by earnings and cash flows.
| Key Figure | Ratio |
|---|---|
| EPS-based | 48.32 % |
| Free Cash Flow-based | 57.14 % |
The payout ratios reflect a disciplined financial strategy, suggesting that the dividends are within sustainable limits with regard to both profits and cash flow, thereby minimizing the risk of future cuts.
Cashflow & Capital Efficiency ✅
Understanding the cash flow and capital efficiency metrics is critical for evaluating the sustainability of future dividends and growth potential. These metrics also provide insights into operational efficiency and managerial foresight.
| Metric | 2024 | 2023 | 2022 |
|---|---|---|---|
| Free Cash Flow Yield | 7.05% | 5.68% | -1.94% |
| Earnings Yield | 6.44% | 6.16% | 3.57% |
| CAPEX to Operating Cash Flow | 39.24% | 55.75% | 137.58% |
| Stock-based Compensation to Revenue | 0.28% | 0.23% | 0.20% |
| Free Cash Flow / Operating Cash Flow Ratio | 60.76% | 44.25% | -37.58% |
The cash flow metrics illustrate a robust capability to fund dividends and reinvest in business operations. The Free Cash Flow Yield and other indicators project a solid basis for sustainable financial operations.
Balance Sheet & Leverage Analysis ⚠️
The leverage metrics highlight Target's ability to manage its debt and financial obligations. These figures play a crucial role in evaluating the firm's long-term solvency and liquidity position.
| Metric | 2024 | 2023 | 2022 |
|---|---|---|---|
| Debt-to-Equity | 1.36 | 1.46 | 1.70 |
| Debt-to-Assets | 34.40% | 35.49% | 35.76% |
| Debt-to-Capital | 57.54% | 59.39% | 62.94% |
| Net Debt to EBITDA | 2.62 | 1.84 | 2.53 |
| Current Ratio | 0.94 | 0.91 | 0.92 |
| Quick Ratio | 0.32 | 0.29 | 0.22 |
| Financial Leverage | 3.94 | 4.12 | 4.75 |
The balance sheet reflects moderate levels of leverage and debt, suggesting a vigilant approach to financial risk, ensuring sufficient liquidity to cover liabilities and invest in business growth.
Fundamental Strength & Profitability 🏦
These metrics represent Target's dedication to maintaining strong profit margins and returns, which are essential for understanding the company’s value creation capacity.
| Metric | 2024 | 2023 | 2022 |
|---|---|---|---|
| Return on Equity | 27.89% | 30.81% | 24.75% |
| Return on Assets | 7.08% | 7.48% | 5.21% |
| Net Margin | 3.84% | 3.85% | 2.55% |
| EBIT Margin | 5.32% | 5.40% | 3.57% |
| EBITDA Margin | 5.42% | 8.03% | 6.10% |
| Gross Margin | 28.21% | 27.54% | 24.57% |
| R&D to Revenue | 0% | 0% | 0% |
Target manages to maintain healthy margins and returns, commensurate with its operational scale, adding to its robust fundamentals and allowing reinvestment in core business and shareholder returns.
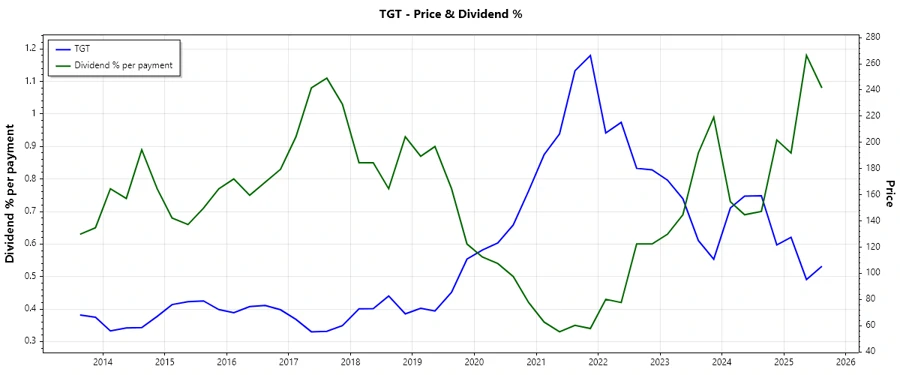
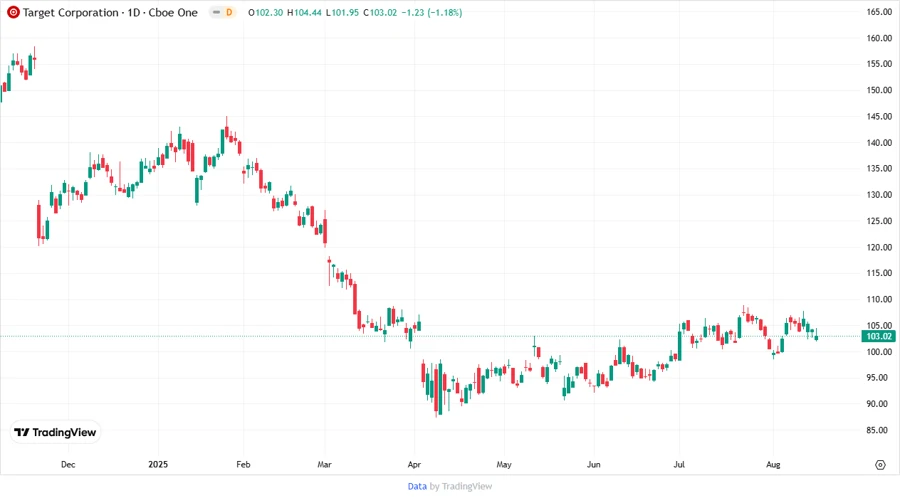
Price Development 📊
Dividend Scoring System 💹
| Category | Rating | Score |
|---|---|---|
| Dividend Yield | 4/5 | |
| Dividend Stability | 5/5 | |
| Dividend Growth | 3/5 | |
| Payout Ratio | 4/5 | |
| Financial Stability | 4/5 | |
| Dividend Continuity | 5/5 | |
| Cashflow Coverage | 3/5 | |
| Balance Sheet Quality | 3/5 |
Overall Score: 31/40
Rating 🏅
In summary, Target Corporation offers a compelling dividend profile with an extensive history of stable and reliable payments. The company presents moderate growth prospects with a robust yield, making it a wise choice for income-oriented investors seeking solid returns with relatively low risk.
Smart Data Insight
Master the Perfect Entry & Exit for this Stock
Don't leave your profits to chance. Historically, this stock follows specific seasonal patterns that institutional traders use to maximize returns.
- ✅ Identify the "Golden Buying Window"
- ✅ Avoid high-risk correction cycles
- ✅ Backtested data from the last 20+ years