June 25, 2026 a 09:03 am

TFC: Trend and Support & Resistance Analysis - Truist Financial Corporation
Truist Financial Corporation's stock exhibits significant potential given its extensive array of financial services and strong presence in the US banking sector. However, the stock's recent decline necessitates careful technical analysis to determine future trends. Continued monitoring of key support and resistance levels is essential to assess the stock's movement in the coming months.
Trend Analysis
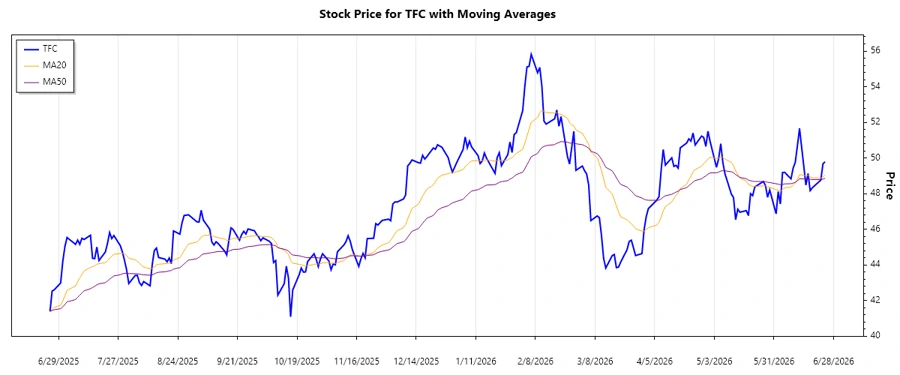
Analyzing the TFC daily closing prices reveals the presence of a recent downtrend. The calculation of the EMA (Exponential Moving Average) for 20 and 50 days indicates that the EMA20 is currently below the EMA50, confirming a bearish sentiment.
| Date | Closing Price | Trend |
|---|---|---|
| June 24, 2026 | $49.79 | ▼ |
| June 23, 2026 | $49.67 | ▼ |
| June 22, 2026 | $48.76 | ▼ |
| June 18, 2026 | $48.33 | ▼ |
| June 17, 2026 | $48.17 | ▼ |
| June 16, 2026 | $49.13 | ▲ |
| June 15, 2026 | $48.48 | ▼ |
In conclusion, the bearish trend is dominant, with EMA20 consistently below EMA50, signaling ongoing downward momentum.
Support and Resistance
The technical analysis identifies key support and resistance zones based on recent closing prices. Support zones are established at $48.00-$48.20 and $46.50-$46.70, while resistance levels are noted at $50.00-$50.20 and $51.50-$51.70.
| Zone Type | From | To |
|---|---|---|
| Support | 48.00 | 48.20 |
| Support | 46.50 | 46.70 |
| Resistance | 50.00 | 50.20 |
| Resistance | 51.50 | 51.70 |
The current price is slightly above the support zone of $48.00-$48.20, indicating a potential stabilization or bounce point. However, breaking below these levels could result in further downside.
Conclusion
The technical indicators suggest bearish momentum in the Truist Financial Corporation stock, as EMA20 trails EMA50 in a downtrend. Current fluctuations near the support zone denote potential recovery, though crossing below could invite further declines. Prospective investors should weigh the risks of an extended bearish phase against resilient fundamentals within Truist's expansive banking services. Monitoring key support and resistance levels can provide crucial insight into future price action and investment decisions.
Smart Data Insight
Master the Perfect Entry & Exit for this Stock
Don't leave your profits to chance. Historically, this stock follows specific seasonal patterns that institutional traders use to maximize returns.
- ✅ Identify the "Golden Buying Window"
- ✅ Avoid high-risk correction cycles
- ✅ Backtested data from the last 20+ years