January 31, 2026 a 05:15 am

TFC: Fibonacci Analysis - Truist Financial Corporation
Truist Financial Corporation's stock, TFC, has shown considerable growth over recent months. As a dominant player in the banking sector, its comprehensive range of services continues to support its positive market trajectory. Investors should be mindful of both technical and fundamental factors to assess future movement accurately.
Fibonacci Analysis
| Details | Information |
|---|---|
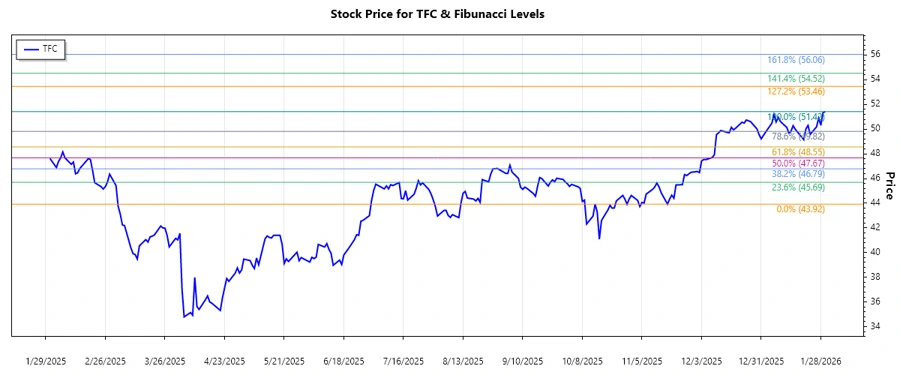
| Trend Start Date | 2025-11-17 |
| Trend End Date | 2026-01-30 |
| High Price | $51.42 on 2026-01-30 |
| Low Price | $43.92 on 2025-11-17 |
| Fibonacci Level | Price Level |
|---|---|
| 0.236 | $49.87 |
| 0.382 | $48.62 |
| 0.5 | $47.67 |
| 0.618 | $46.72 |
| 0.786 | $45.36 |
The current price is $50.31, which lies within the 0.236 Fibonacci Retracement level. This suggests a possible support level, and traders might look for bullish signals around this price zone.
Conclusion
The stock of Truist Financial Corporation has demonstrated a robust bullish trend since late 2025, reaching a peak in early 2026. The current retracement levels indicate potential zones of support where traders might consider entering long positions. However, it is crucial to watch for broader market trends and economic indicators that could affect the financial sector. As TFC has a solid foundation in diverse financial services, it remains an attractive option for long-term investors, albeit with caution if market conditions deteriorate.