December 08, 2025 a 03:15 pm

TFC: Fibonacci Analysis - Truist Financial Corporation
The Truist Financial Corporation stock has demonstrated a complex trajectory over recent months. Notably, the stock has been in a significant upward trend from mid-2025, indicating positive investor sentiment and strong market performance. The bullish behavior in stock prices hints at potential growth opportunities for traders and investors interested in financial services expansion in the Southeastern and Mid-Atlantic United States.
Fibonacci Analysis
| Description | Data |
|---|---|
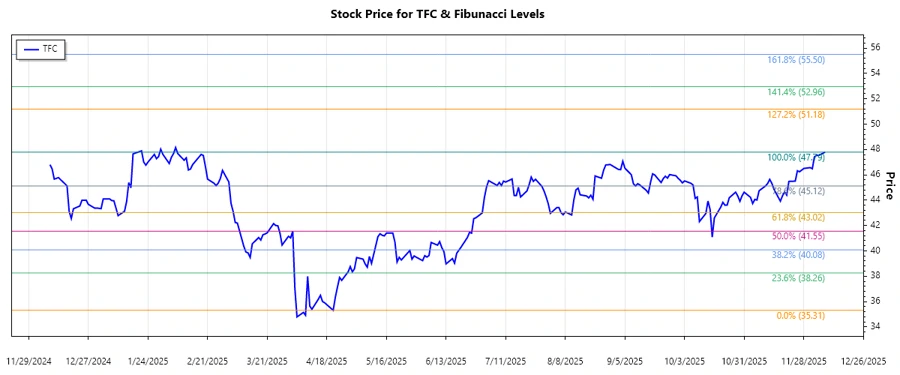
| Trend Start Date | 2025-04-22 |
| Trend End Date | 2025-12-08 |
| Highest Point | $47.79 on 2025-12-08 |
| Lowest Point | $35.31 on 2025-04-21 |
| Fibonacci Level | Price Level |
|---|---|
| 0.236 | $38.57 |
| 0.382 | $40.40 |
| 0.5 | $41.55 |
| 0.618 | $42.70 |
| 0.786 | $44.40 |
The current price of $47.79 suggests that the stock is not within any retracement levels, indicating potential continuation or overbought conditions. Technically, this level suggests the stock might find support at the 0.5 or 0.618 retracement levels if a pullback occurs.
Conclusion
The past few months have seen Truist Financial Corporation's stock price embark on a notable upward trajectory. This bullish trend reflects increased market confidence and potential for continued growth. However, analysts should consider possible challenges that could introduce volatility, such as market saturation and shifts in the financial industry landscape. While the stock appears strong, careful monitoring is advised for signs of retracement that could offer buying opportunities or predict reversals. As of now, the stock is positioned favorably for potential upside continuation.