July 05, 2026 a 02:46 am

TFC: Dividend Analysis - Truist Financial Corporation
Truist Financial Corporation, a leader in its sector, showcases a robust dividend profile with impressive consistency and growth potential. With a history of consistent dividend payments over 42 years, investors can rely on Truist for steady income. Its relatively stable payout ratio suggests manageable and sustainable dividends, offering reassurance in volatile markets.
📊 Overview
Truist Financial Corporation operates within a competitive sector, offering a dividend yield of 4.24%. Its current dividend per share is $2.36, sustained over a remarkable 42 years of consistent history, with no recent dividend cuts or suspensions.
| Detail | Value |
|---|---|
| Sector | Financial Services |
| Dividend Yield | 4.24% |
| Current Dividend Per Share | $2.36 |
| Dividend History | 42 years |
| Last Cut/Suspension | None |
🗣️ Dividend History
Analyzing the dividend history reveals consistent shareholder value over decades. Such stability is crucial for investors seeking predictable income streams. The company's ability to maintain this track record despite economic downturns exemplifies its fundamental strength.
| Year | Dividend Per Share (USD) |
|---|---|
| 2026 | $1.04 |
| 2025 | $2.08 |
| 2024 | $2.08 |
| 2023 | $2.08 |
| 2022 | $2.00 |
📈 Dividend Growth
Dividend growth is a reflection of a company's profitability potential, indicating its ability to increase shareholder returns. Truist has demonstrated average dividend growth of 2.93% over five years, suggesting moderate yet consistent increases in shareholder payouts.
| Time | Growth |
|---|---|
| 3 years | 1.32% |
| 5 years | 2.93% |
The average dividend growth is 2.93% over 5 years. This shows moderate but steady dividend growth.
✅ Payout Ratio
Analyzing payout ratios ensures dividends are not overstretched, maintaining company cash flow health. With an EPS-based payout ratio of 53.41% and an FCF-based ratio of 51.93%, Truist maintains a balanced approach between rewarding shareholders and sustaining operations.
| Key Figure | Ratio |
|---|---|
| EPS-based | 53.41% |
| Free Cash Flow-based | 51.93% |
These payout ratios suggest that Truist manages its dividend strategy prudently, balancing growth while preserving capital.
📉 Cashflow & Capital Efficiency
Truist exhibits strong cash flow management with indicators such as Free Cash Flow Yield and CAPEX to Operating Cash Flow ratios indicating efficient capital use. This robust financial management underpins its ability to sustain and potentially grow dividends.
| Metric | 2023 | 2024 | 2025 |
|---|---|---|---|
| Free Cash Flow Yield | 17.55% | 3.75% | 9.20% |
| Earnings Yield | -2.22% | 8.34% | 8.51% |
| CAPEX to Operating Cash Flow | 0% | 0% | 0% |
| Stock-based Compensation to Revenue | 0% | 0% | 0% |
| Free Cash Flow / Operating Cash Flow Ratio | 100% | 100% | 100% |
Truist demonstrates commendable cash flow stability, assuring investors of continued capital returns.
Balance Sheet & Leverage Analysis
A sound balance sheet guarantees long-term financial security. Analyzing leverage ratios helps assess the company's debt levels and potential risks. Truist maintains a reasonable balance, as shown by its Debt-to-Equity and other leverage metrics.
| Metric | 2023 | 2024 | 2025 |
|---|---|---|---|
| Debt-to-Equity | 1.05 | 0.98 | 1.07 |
| Debt-to-Assets | 0.12 | 0.12 | 0.13 |
| Debt-to-Capital | 0.51 | 0.49 | 0.52 |
| Net Debt to EBITDA | 70.87 | 59.52 | 4.74 |
| Current Ratio | 0.26 | 0.14 | 0.87 |
| Quick Ratio | 0.26 | 0.14 | 0.87 |
| Financial Leverage | 9.06 | 8.34 | 8.40 |
These metrics indicate that Truist is managing its financial leverage well, maintaining stability and liquidity to ensure ongoing operational success.
📈 Fundamental Strength & Profitability
Strong fundamental metrics are crucial for sustained profitability and growth. Truist's stable returns on equity and assets highlight its effective use of resources.
| Metric | 2023 | 2024 | 2025 |
|---|---|---|---|
| Return on Equity | -1.85% | 7.57% | 8.14% |
| Return on Assets | -0.20% | 0.91% | 0.97% |
| Net Profit Margin | -3.64% | 19.87% | 17.44% |
| EBIT Margin | -2.55% | -2.48% | 20.86% |
| EBITDA Margin | 1.50% | 1.56% | 23.17% |
| Gross Margin | 59.81% | 47.04% | 62.21% |
| Research & Development to Revenue | 0% | 0% | 0% |
Despite some margin fluctuations, Truist maintains reasonable profitability ratios and competitive return metrics, indicating efficient management.
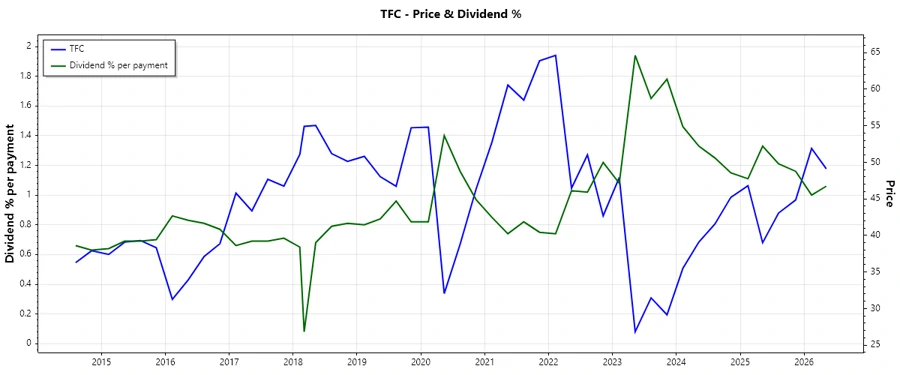
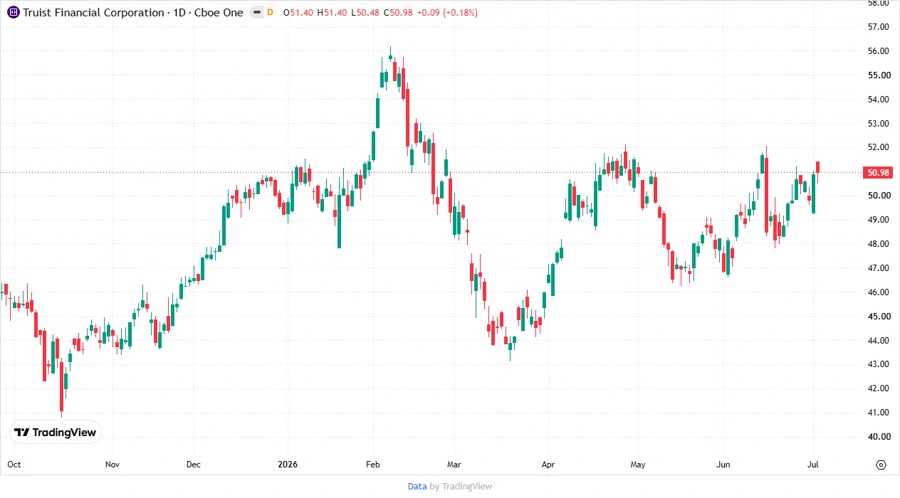
📉 Price Development
Dividend Scoring System
| Category | Score | Bar |
|---|---|---|
| Dividend Yield | 4 | |
| Dividend Stability | 5 | |
| Dividend Growth | 3 | |
| Payout Ratio | 4 | |
| Financial Stability | 4 | |
| Dividend Continuity | 5 | |
| Cashflow Coverage | 4 | |
| Balance Sheet Quality | 3 |
Total Score: 32/40
Rating
Truist Financial Corporation stands as a solid choice for dividend investors. With a strong history of payments, reasonable payout ratios, and prudent financial management, it presents a balanced investment in a stable financial entity. Continued monitoring of its growth and stability metrics will be key for realizing long-term investment goals.
Smart Data Insight
Master the Perfect Entry & Exit for this Stock
Don't leave your profits to chance. Historically, this stock follows specific seasonal patterns that institutional traders use to maximize returns.
- ✅ Identify the "Golden Buying Window"
- ✅ Avoid high-risk correction cycles
- ✅ Backtested data from the last 20+ years