April 11, 2026 a 12:46 pm

TFC: Dividend Analysis - Truist Financial Corporation
Truist Financial Corporation demonstrates a robust history of dividend payments with a stable yield. Their commitment to shareholder returns is evident from the lengthy history of consistent dividends without cuts or suspensions. However, investors must carefully consider the company's current financial stability and growth prospects given the modest dividend growth rate.
📊 Overview
This section provides a concise overview of Truist Financial Corporation's dividend metrics and its sector positioning.
| Metric | Value |
|---|---|
| Sector | Financial Services |
| Dividend yield | 4.01% |
| Current dividend per share | 2.36 USD |
| Dividend history | 42 years |
| Last cut or suspension | None |
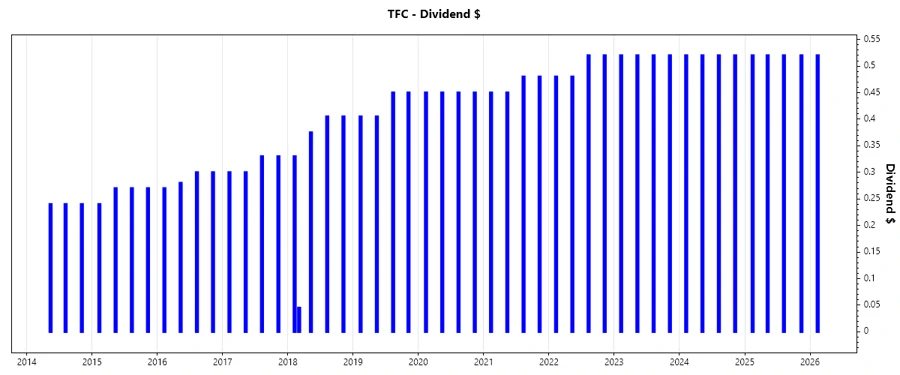
🗣️ Dividend History
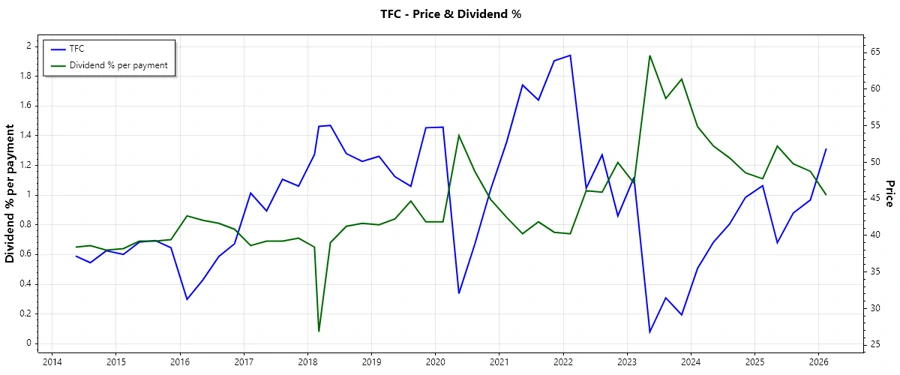
The dividend history showcases consistent payouts, reflecting the company's strong commitment to returning value to shareholders. This is crucial for income-focused investors seeking reliability in dividends.
| Year | Dividend per Share (USD) |
|---|---|
| 2026 | 0.52 |
| 2025 | 2.08 |
| 2024 | 2.08 |
| 2023 | 2.08 |
| 2022 | 2.00 |
📈 Dividend Growth
Dividend growth is vital for long-term investment value. Consistent growth can lead to higher income and capital gains over time.
| Time | Growth |
|---|---|
| 3 years | 1.32% |
| 5 years | 2.93% |
The average dividend growth is 2.93% over 5 years. This shows moderate but steady dividend growth.
⚠️ Payout Ratio
Payout ratios are indicators of sustainability. An optimal ratio implies the company's ability to pay dividends without compromising financial health.
| Key Figure | Ratio |
|---|---|
| EPS-based | 56.45% |
| Free cash flow-based | 51.46% |
The EPS-based payout ratio of 56.45% and FCF-based ratio of 51.46% indicate a balanced approach, ensuring dividend payments are sustainable with room for reinvestment.
🧮 Cashflow & Capital Efficiency
Understanding cash flow efficiency and capital allocation aids in evaluating a firm's operational effectiveness and investment potential.
| Metric | 2023 | 2024 | 2025 |
|---|---|---|---|
| Free Cash Flow Yield | 17.55% | 3.75% | 9.20% |
| Earnings Yield | -2.22% | 8.34% | 8.51% |
| CAPEX to Operating Cash Flow | 0% | 0% | 0% |
| Stock-based Compensation to Revenue | 0 | 0 | 0 |
| Free Cash Flow / Operating Cash Flow Ratio | 1.00 | 1.00 | 1.00 |
The robust free cash flow yield and consistent operating cash flow ratios suggest strong cash flow management, essential for funding dividends and growth.
💼 Balance Sheet & Leverage Analysis
Evaluating balance sheet figures helps assess financial health, debt levels, and potential risk factors.
| Metric | 2023 | 2024 | 2025 |
|---|---|---|---|
| Debt-to-Equity | 1.05 | 0.98 | 1.07 |
| Debt-to-Assets | 0.116 | 0.117 | 0.127 |
| Debt-to-Capital | 0.512 | 0.494 | 0.517 |
| Net Debt to EBITDA | 70.87 | 59.52 | 4.74 |
| Current Ratio | 0.262 | 0.14 | 0.866 |
| Quick Ratio | 0.262 | 0.14 | 0.866 |
| Financial Leverage | 9.06 | 8.34 | 8.40 |
High leverage indicates potential risk, but improved coverage and decreasing net debt to EBITDA suggest effective debt management.
📉 Fundamental Strength & Profitability
Profitability metrics give insights into efficiency and economic value creation, essential for long-term growth.
| Metric | 2023 | 2024 | 2025 |
|---|---|---|---|
| Return on Equity | -1.85% | 7.57% | 8.14% |
| Return on Assets | -0.20% | 0.91% | 0.97% |
| Margins: Net | -3.64% | 19.87% | 17.44% |
| EBIT | -2.55% | -2.48% | 20.86% |
| EBITDA | 1.50% | 1.56% | 23.17% |
| Gross | 59.81% | 47.04% | 62.21% |
| Research & Development to Revenue | 0 | 0 | 0 |
While returns fluctuate, gross and EBITDA margins reflect robust operational efficiency, supporting profitability.
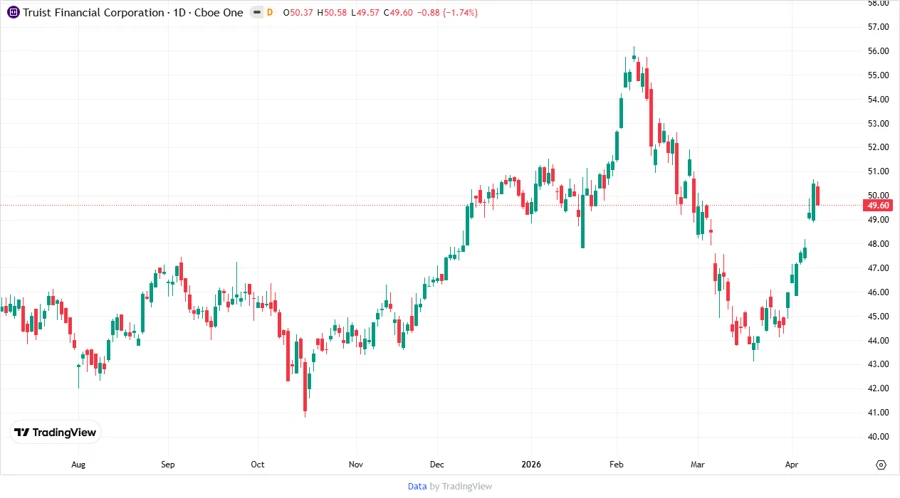
📊 Price Development
✅ Dividend Scoring System
| Criterion | Score | Score Bar |
|---|---|---|
| Dividend yield | 4 | |
| Dividend Stability | 5 | |
| Dividend growth | 3 | |
| Payout ratio | 4 | |
| Financial stability | 3 | |
| Dividend continuity | 5 | |
| Cashflow Coverage | 4 | |
| Balance Sheet Quality | 3 |
Total Score: 31/40
🟢 Rating
Truist Financial Corporation maintains a solid dividend profile marked by stability and reasonable growth. The company deserves a favorable review for investors seeking steady income and moderate growth potential. Future performance should be monitored, particularly around leverage and financial stability, to ensure sustainable returns.