February 25, 2026 a 02:46 am


TFC: Dividend Analysis - Truist Financial Corporation
Truist Financial Corporation presents an intriguing investment case with its strong dividend yield of 4.01% and a historically resilient dividend history spanning 42 years. Despite facing some hurdles in their recent financial performances, the company's strategic focus on preserving shareholder value through consistent dividend payouts remains evident. Investors can expect a moderated, stable dividend growth pattern, supported by calculated payout ratios indicating prudent financial stewardship.
📊 Overview
Evaluating the core metrics of Truist Financial Corporation provides clarity on the strength and sustainability of its dividend policy within the financial services sector.
| Metric | Value |
|---|---|
| Sector | Financial |
| Dividend Yield | 4.01% |
| Current Dividend per Share | 2.08 USD |
| Dividend History | 42 years |
| Last Cut or Suspension | None |
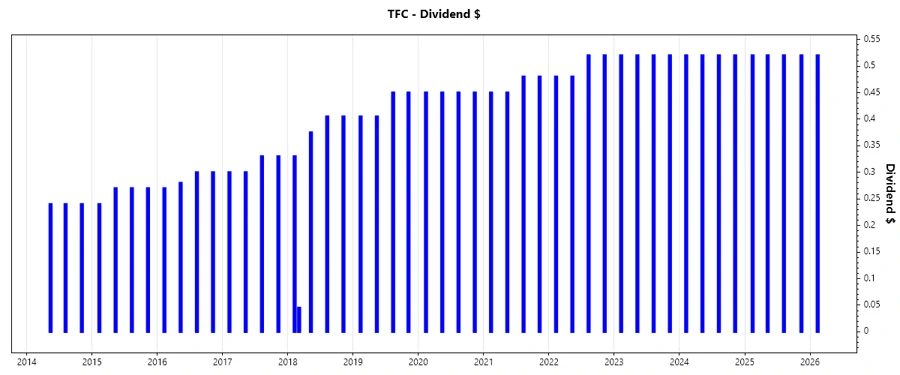
🗣️ Dividend History
The uninterrupted 42-year dividend history reflects Truist's commitment to returning capital to shareholders, a crucial aspect for yield-focused investors. This consistency adds a layer of reliability when assessing investment stability.
| Year | Dividend per Share (USD) |
|---|---|
| 2026 | 0.52 |
| 2025 | 2.08 |
| 2024 | 2.08 |
| 2023 | 2.08 |
| 2022 | 2.00 |
📈 Dividend Growth
Analyzing the dividend growth rate is vital for understanding potential future income streams. The company's moderate growth reflects a sustainable path aligning with long-term value generation.
| Time | Growth |
|---|---|
| 3 years | 1.32% |
| 5 years | 2.93% |
The average dividend growth is 2.93% over 5 years. This shows moderate but steady dividend growth.
📉 Payout Ratio
Payout ratios are critical in evaluating a company's ability to maintain dividends during downturns. Truist's EPS-based and FCF-based payout ratios present a confident outlook on dividend continuity.
| Key Figure | Ratio |
|---|---|
| EPS-based | 49.67% |
| Free Cash Flow-based | 84.28% |
The EPS payout ratio at 49.67% indicates a healthy margin for covering dividends, suggesting a resilient policy under varied earnings landscapes. Meanwhile, the 84.28% FCF payout signals stronger utilization of financial resources to support shareholder returns.
✅ Cashflow & Capital Efficiency
Cash flow and capital efficiency are indispensable for sustaining and enhancing shareholder value over the long term. Truist's data ensures stakeholders of meticulous financial management.
| Metric | 2023 | 2024 | 2025 |
|---|---|---|---|
| Free Cash Flow Yield | 17.55% | 3.75% | 3.47% |
| Earnings Yield | -2.22% | 8.34% | 8.51% |
| CAPEX to Operating Cash Flow | 0% | 0% | 0% |
| Stock-based Compensation to Revenue | 0% | 0% | 0% |
| Free Cash Flow / Operating Cash Flow Ratio | 1 | 1 | 1 |
Truist's stable FCF/Ops ratio and low CAPEX requirements highlight its robust cash management practices, underpinning its ability to maintain dividend payouts and reinvest in key growth areas.
⚠️ Balance Sheet & Leverage Analysis
Understanding leverage and balance sheet health provides insights into a firm's long-term viability and ability to service obligations.
| Metric | 2023 | 2024 | 2025 |
|---|---|---|---|
| Debt-to-Equity | 1.05 | 0.98 | 1.07 |
| Debt-to-Assets | 11.60% | 11.72% | 12.75% |
| Debt-to-Capital | 51.25% | 49.44% | 51.71% |
| Net Debt to EBITDA | 70.87 | 59.52 | 4.74 |
| Current Ratio | 0.26 | 0.14 | 0.87 |
| Quick Ratio | 0.26 | 0.14 | 0.87 |
| Financial Leverage | 9.06 | 8.34 | 8.40 |
Zahlen belegen Truists mäßiges Hebelniveau mit stabilem Bilanzmanagement, was eine Balance zwischen Wachstumschancen und Kontrollrisiken schafft.
💡 Fundamental Strength & Profitability
Profitabilitätsmetriken beschreiben die Effizienz der Geschäftsabläufe und das Potenzial, nachhaltige Renditen zu erzielen.
| Metric | 2023 | 2024 | 2025 |
|---|---|---|---|
| Return on Equity | -1.85% | 7.57% | 8.14% |
| Return on Assets | -0.20% | 0.91% | 0.97% |
| Net Margin | -3.64% | 19.87% | 17.44% |
| EBIT Margin | -2.55% | -2.48% | 20.86% |
| EBITDA Margin | 1.50% | 1.56% | 23.17% |
| Gross Margin | 59.81% | 47.04% | 62.21% |
| R&D to Revenue | 0% | 0% | 0% |
Truists Fundamentaldaten heben ihre operative Bemühungen hervor, sich von früheren Rückgängen zu erholen, mit einem stetig positiven Ertragstrend, der das Potenzial für zukünftiges Wachstum zeigt.
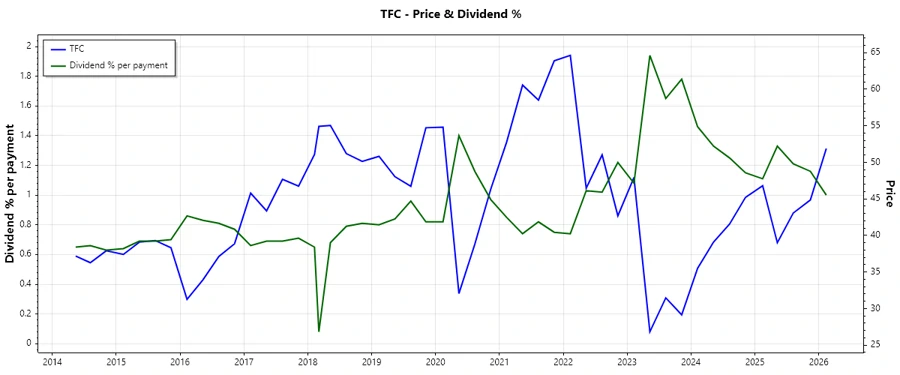
📉 Price Development
🔍 Dividend Scoring System
| Category | Score | Indicator |
|---|---|---|
| Dividend Yield | 4 | |
| Dividend Stability | 5 | |
| Dividend Growth | 3 | |
| Payout Ratio | 4 | |
| Financial Stability | 3 | |
| Dividend Continuity | 5 | |
| Cashflow Coverage | 4 | |
| Balance Sheet Quality | 3 |
Overall Score: 31/40
🌟 Rating
Overall, Truist Financial Corporation shows a strong dividend profile supported by its robust historical performance and strategic financial management. With potential moderate growth, the firm remains a formidable choice for dividend-oriented investors looking for consistency and modest appreciation in yield.