November 02, 2025 a 11:31 am

TFC: Dividend Analysis - Truist Financial Corporation
Truist Financial Corporation exhibits a robust dividend profile, characterized by a consistent payment history of 41 years without major interruptions. With a current dividend yield of 4.66%, it represents a potentially attractive option for income investors, notwithstanding concerns over free cash flow payout ratios.
📊 Overview
Truist Financial Corporation operates in the financial sector, offering a notable dividend yield of 4.66% with a current dividend per share at 2.36 USD. The corporation boasts a stable dividend history extending over 41 years, with the last cut or suspension recorded in 2014.
| Criteria | Details |
|---|---|
| Sector | Financial |
| Dividend yield | 4.66% |
| Current dividend per share | 2.36 USD |
| Dividend history | 41 years |
| Last cut or suspension | 2014 |
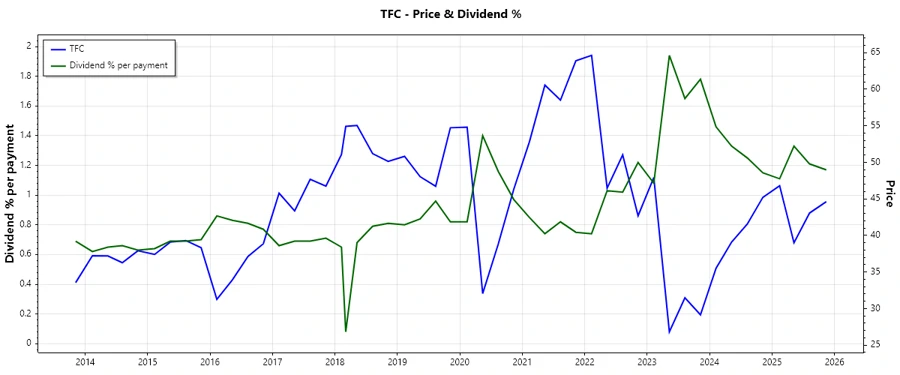
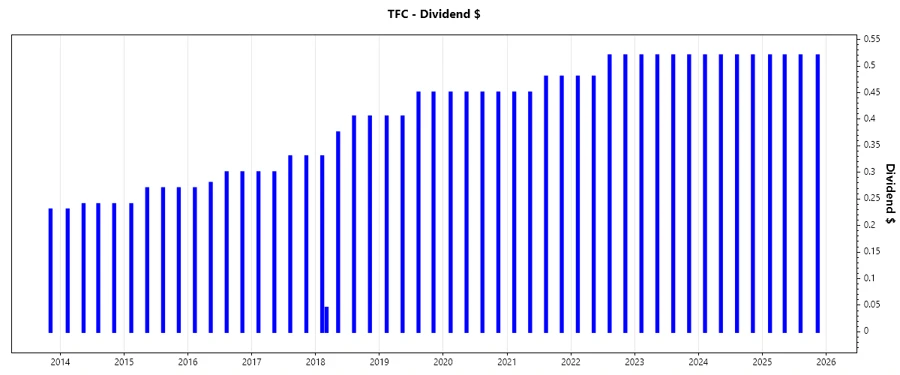
📉 Dividend History
Truist has demonstrated a stable dividend distribution policy, which is crucial for investors seeking reliable income streams. The history of consistent payments signals strong financial health and commitment to returning value to shareholders.
| Year | Dividend Per Share (USD) |
|---|---|
| 2025 | 2.08 |
| 2024 | 2.08 |
| 2023 | 2.08 |
| 2022 | 2.00 |
| 2021 | 1.86 |
📈 Dividend Growth
Dividend growth is a critical indicator of a company's profitability and shareholder value enhancement over time. Truist’s dividend growth over 3 and 5 years showcases its commitment to increasing shareholder dividends.
| Time | Growth |
|---|---|
| 3 years | 3.80% |
| 5 years | 3.99% |
The average dividend growth is 3.99% over 5 years. This shows moderate but steady dividend growth, reflecting financial stability and a focus on rewarding shareholders.
🗣️ Payout Ratio
Payout ratios provide insight into the sustainability of dividend payments by highlighting how much of the earnings and free cash flow are allocated to distributed dividends.
| Key figure | Ratio |
|---|---|
| EPS-based | 60% |
| Free cash flow-based | 310% |
While the EPS-based payout ratio at 60% indicates a healthy approach, the high free cash flow payout ratio of 310% poses risks, as it suggests that dividends exceed the cash generated, potentially requiring borrowing or reserves.
✅ Cashflow & Capital Efficiency
The cash flow and capital efficiency metrics provide insights into the operational efficiency and financial health of a company, determining how well it can sustain its capital expenditures and dividend policies.
| Metric | 2024 | 2023 | 2022 |
|---|---|---|---|
| Free Cash Flow Yield | 3.75% | 17.55% | 18.40% |
| Earnings Yield | 8.34% | -2.22% | 10.95% |
| CAPEX to Operating Cash Flow | 0 | 0 | 5.09% |
| Stock-based Compensation to Revenue | 0 | 0 | 0 |
| Free Cash Flow / Operating Cash Flow Ratio | 100% | 100% | 94.91% |
The company's cash flow yield and operating cash flow dynamics show resilience, though the company's heavy reliance on free cash flow should be addressed to ensure long-term sustainability.
⚠️ Balance Sheet & Leverage Analysis
A comprehensive analysis of the balance sheet and leverage allows for assessment of financial stability and risks associated with the company's debt structure and liquidity.
| Metric | 2024 | 2023 | 2022 |
|---|---|---|---|
| Debt-to-Equity | 0.98 | 1.05 | 1.08 |
| Debt-to-Assets | 11.72% | 11.60% | 11.72% |
| Debt-to-Capital | 49.44% | 51.25% | 51.82% |
| Net Debt to EBITDA | 59.52 | 70.87 | 5.20 |
| Current Ratio | 0.14 | 0.26 | 0.24 |
| Quick Ratio | 0.14 | 0.26 | 0.24 |
| Financial Leverage | 8.34 | 9.06 | 9.18 |
High leverage ratios and net debt to EBITDA suggest significant leverage and debt load. Strategic financial management is needed to manage this effectively and ensure liquidity.
Fundamental Strength & Profitability
Evaluating fundamental strength and profitability helps to gauge the company's ability to generate profits and sustain its competitive position in the market.
| Metric | 2024 | 2023 | 2022 |
|---|---|---|---|
| Return on Equity | 7.57% | -1.85% | 10.34% |
| Return on Assets | 0.91% | -0.20% | 1.13% |
| Net Margin | 19.87% | -3.64% | 28.08% |
| EBIT Margin | -2.48% | -2.55% | 31.53% |
| EBITDA Margin | 1.56% | 1.50% | 37.66% |
| Gross Margin | 47.04% | 59.81% | 86.10% |
| R&D to Revenue | 0 | 0 | 0 |
While the profitability indicators fluctuate, there is potential for recovery, provided operational efficiencies and market conditions align favorably.
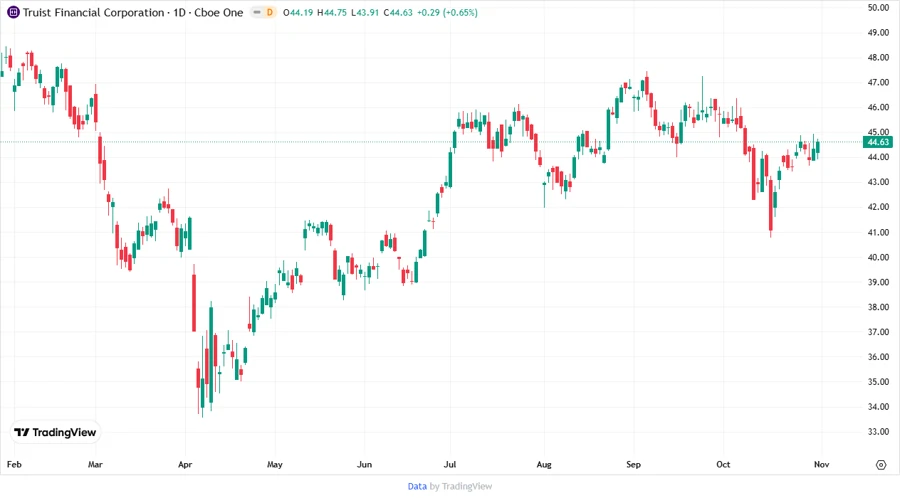
Price Development
Dividend Scoring System
| Criteria | Score | Score Bar |
|---|---|---|
| Dividend yield | 4 | |
| Dividend Stability | 4 | |
| Dividend growth | 3 | |
| Payout ratio | 2 | |
| Financial stability | 3 | |
| Dividend continuity | 5 | |
| Cashflow Coverage | 3 | |
| Balance Sheet Quality | 2 |
Overall Score: 26/40
Rating
Truist Financial Corporation's dividend profile is appealing for yield-focused investors, with strong historical stability. However, caution is warranted due to high payout ratios from free cash flow and significant leverage. An investor looking for moderate risk in the financial sector may find TFC a valuable addition, contingent on improved cash flow management and leverage reduction strategies.
Smart Data Insight
Master the Perfect Entry & Exit for this Stock
Don't leave your profits to chance. Historically, this stock follows specific seasonal patterns that institutional traders use to maximize returns.
- ✅ Identify the "Golden Buying Window"
- ✅ Avoid high-risk correction cycles
- ✅ Backtested data from the last 20+ years