October 18, 2025 a 07:46 am

TFC: Dividend Analysis - Truist Financial Corporation
Truist Financial Corporation demonstrates a stable dividend history with over four decades of consistent dividend payments, reflecting its commitment to shareholder value. With a generous dividend yield of 4.83% and a slight upward growth trajectory over the past years, TFC remains a formidable choice for income-focused investors. However, its high payout ratios may warrant closer attention, especially given market volatility and economic uncertainties.
📊 Overview
| Key Metric | Details |
|---|---|
| Sector | Financials |
| Dividend Yield | 4.83% |
| Current Dividend Per Share | 2.36 USD |
| Dividend History | 41 years |
| Last Cut or Suspension | None |
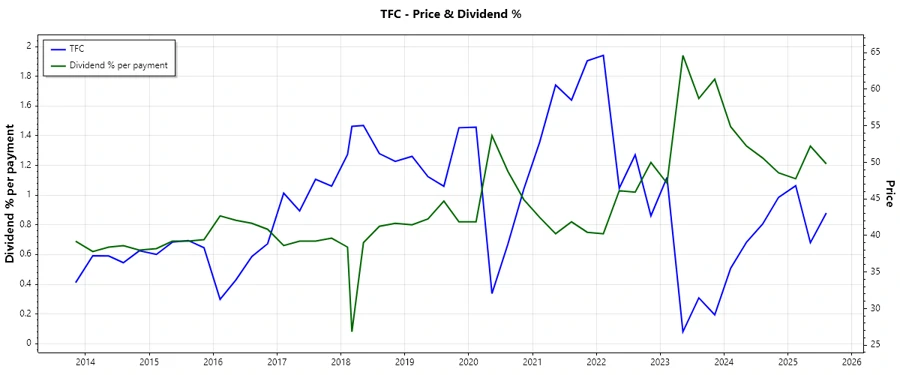
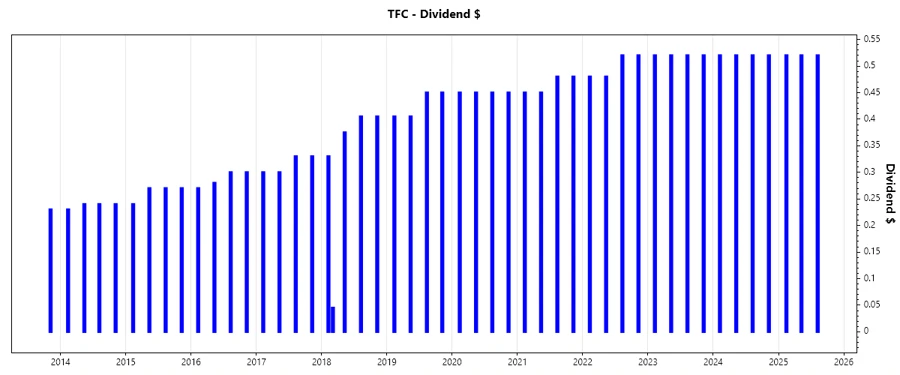
📉 Dividend History
Analyzing the dividend history gives insight into the company's commitment to returning capital to shareholders. A 41-year track record without cuts signifies strong financial health and prioritization of dividend payments by Truist Financial.
| Year | Dividend Per Share (USD) |
|---|---|
| 2025 | 1.56 |
| 2024 | 2.08 |
| 2023 | 2.08 |
| 2022 | 2.00 |
| 2021 | 1.86 |
📈 Dividend Growth
Dividend growth rates provide insights into future earnings potential and management's outlook. Truist Financial shows dividend growth of 3.80% over the last 3 years and 4.00% over 5 years, indicating moderate but steady progression.
| Time | Growth |
|---|---|
| 3 years | 3.80% |
| 5 years | 4.00% |
The average dividend growth is 4.00% over 5 years. This shows moderate but steady dividend growth.
🗣️ Payout Ratio
Payout ratios assess how comfortably a company can pay dividends out of its earnings. Truist Financial's EPS-based payout ratio stands at 60.67%, while its free cash flow payout is higher at 76.52%, suggesting a substantial portion of profit is paid as dividends, which might limit reinvestment in growth.
| Key Figure | Ratio |
|---|---|
| EPS-based | 60.67% |
| Free Cash Flow-based | 76.52% |
The EPS payout ratio of 60.67% allows room for reinvestment, but the higher FCF payout ratio may constrain future growth opportunities.
💡 Cashflow & Capital Efficiency
The cash flow and capital efficiency are crucial in sustaining dividends and achieving growth. With a strong free cash flow yield of 7.23% and a robust return on invested capital, Truist showcases effective capital use and an ability to cover its dividends and growth internally.
| Metric | 2023 | 2024 |
|---|---|---|
| Free Cash Flow Yield | 17.55% | 3.75% |
| Earnings Yield | -2.22% | 8.34% |
| CAPEX to Operating Cash Flow | N/A | N/A |
| Stock-based Compensation to Revenue | N/A | N/A |
| Free Cash Flow / Operating Cash Flow Ratio | 1 | 1 |
The cash flow metrics signify the company's ability to maintain its dividend payout and signify investment potential through efficient capital management.
📉 Balance Sheet & Leverage Analysis
The financial stability of Truist Financial is reflected through its balanced debt ratios and leverage metrics. This stability supports reliable dividend payments amidst debt conditions.
| Metric | 2023 | 2024 |
|---|---|---|
| Debt-to-Equity | 1.05 | 0.98 |
| Debt-to-Assets | 0.12 | 0.12 |
| Debt-to-Capital | 0.51 | 0.49 |
| Net Debt to EBITDA | 70.87 | 59.52 |
| Current Ratio | N/A | 0.14 |
| Quick Ratio | 0.26 | 0.14 |
| Financial Leverage | 9.06 | 8.34 |
The leverage analysis underscores Truist's balanced capital structure, supporting its financial obligations and dividend policy while potentially enhancing growth opportunities.
🚀 Fundamental Strength & Profitability
The fundamental strength and profitability of Truist Financial showcase its resilience in terms of ROE, ROA, and profit margins, which are pivotal for sustainable dividends and reinvestment strategies.
| Metric | 2023 | 2024 |
|---|---|---|
| Return on Equity | -1.85% | 7.57% |
| Return on Assets | -0.20% | 0.91% |
| Net Margin | -3.64% | 19.87% |
| EBIT Margin | -2.55% | -2.48% |
| EBITDA Margin | 1.50% | 1.56% |
| Gross Margin | 59.81% | 47.04% |
| R&D to Revenue | N/A | N/A |
The displayed profitability metrics demonstrate Truist's robust operational performance, which positively impacts its dividend continuity and financial stability.
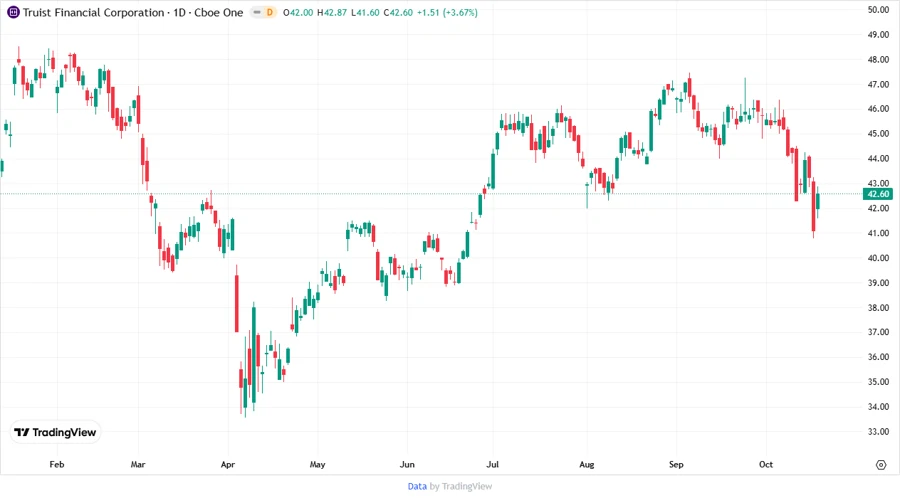
📈 Price Development
🗳️ Dividend Scoring System
| Category | Score | Rating |
|---|---|---|
| Dividend Yield | 5 | |
| Dividend Stability | 5 | |
| Dividend Growth | 3 | |
| Payout Ratio | 3 | |
| Financial Stability | 4 | |
| Dividend Continuity | 5 | |
| Cashflow Coverage | 4 | |
| Balance Sheet Quality | 4 |
Overall Score: 33/40
✅ Rating
Truist Financial Corporation is rated as a reliable dividend-paying stock, particularly suited for long-term income and value-oriented investors. Its stable and consistent dividend policies, backed by steady cash flow and a sound capital structure, underline its investment appeal amidst economic cycles. Potential investors should consider the moderate growth of dividends and the high payout ratios in their valuation analysis.
Smart Data Insight
Master the Perfect Entry & Exit for this Stock
Don't leave your profits to chance. Historically, this stock follows specific seasonal patterns that institutional traders use to maximize returns.
- ✅ Identify the "Golden Buying Window"
- ✅ Avoid high-risk correction cycles
- ✅ Backtested data from the last 20+ years