
May 27, 2026 a 11:31 am
TECH: Dividend Analysis - Bio-Techne Corporation
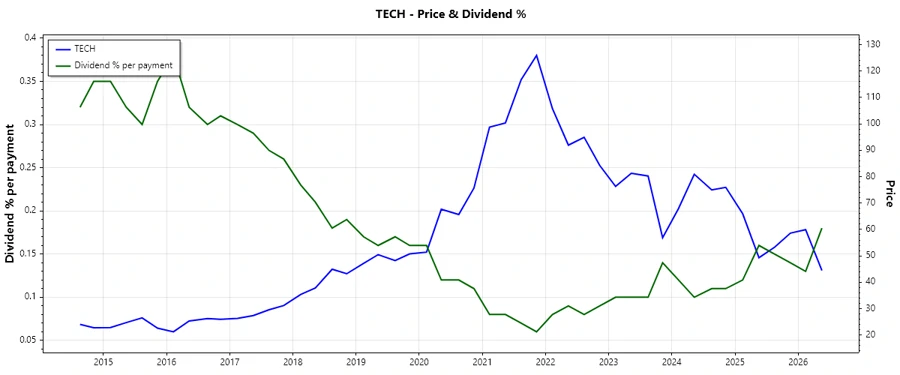
Bio-Techne Corporation, with its robust dividend profile, highlights a stable but relatively low dividend yield. While the five-year dividend growth remains stagnant, the consistent history of dividend payments for 19 years contributes to investor confidence. Overall, the company's payout ratios and free cash flow positions suggest a sustainable dividend policy, albeit current yields might appear less attractive in contemporary markets.
📊 Overview
Bio-Techne Corporation is a prominent player in its sector, maintaining a dividend yield of 0.72% with a current dividend per share of $0.32. Despite not having recent increases in dividends over the past three and five years, the company boasts a continuous dividend history spanning 19 years with no recent cuts or suspensions.
| Metric | Details |
|---|---|
| Sector | Biotechnology |
| Dividend yield | 0.72% |
| Current dividend per share | 0.32 USD |
| Dividend history | 19 years |
| Last cut or suspension | None |
🗣️ Dividend History
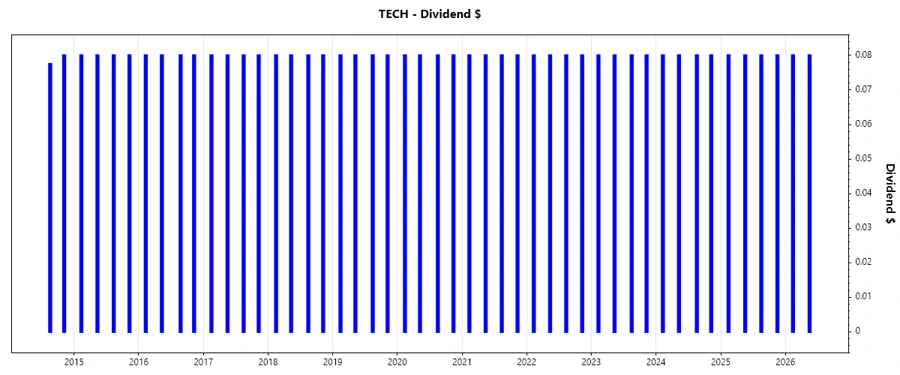
The sustainability and predictability of dividend payments play a crucial role in attracting and retaining investors. Bio-Techne demonstrates a strong track record in maintaining consistent dividend payouts over the years, establishing trustworthiness in uncertain market conditions.
| Year | Dividend per Share |
|---|---|
| 2026 | 0.16 USD |
| 2025 | 0.32 USD |
| 2024 | 0.32 USD |
| 2023 | 0.32 USD |
| 2022 | 0.32 USD |
📈 Dividend Growth
The absence of dividend growth over the last three to five years may raise questions among growth-focused investors. However, maintaining steady dividend payments highlights financial prudence in sustaining operations and fulfilling investor expectations.
| Time | Growth |
|---|---|
| 3 years | 0% |
| 5 years | 0% |
The average dividend growth is 0% over 5 years. This shows moderate but steady dividend growth.
⚠️ Payout Ratio
Payout ratios are fundamental in analyzing the health and sustainability of dividend distributions. Bio-Techne's EPS-based payout ratio stands at 45.51%, while the FCF-based ratio is significantly lower at 18.58%. This shows a well-balanced approach in dividend management, suggesting dividends are well-covered relative to earnings and freecashflow.
| Key figure | Ratio |
|---|---|
| EPS-based | 45.51% |
| Free cash flow-based | 18.58% |
The current payout ratios indicate that Bio-Techne is managing its dividends prudently, not over-relying on earnings or free cash flow. The balanced approach supports the sustainability of future dividends.
Cashflow & Capital Efficiency
Cash flow and capital efficiency metrics provide insights into the company's operational effectiveness and ability to fund its dividend commitments. Key figures demonstrate strong cash flow generation and efficient capital allocation.
| Metric | 2025 | 2024 | 2023 |
|---|---|---|---|
| Free Cash Flow Yield | 3.17% | 2.09% | 1.68% |
| Earnings Yield | 0.91% | 1.49% | 2.22% |
| CAPEX to Operating Cash Flow | 10.78% | 21.03% | 15.03% |
| Stock-based Compensation to Revenue | 3.35% | 3.28% | 3.45% |
| Free Cash Flow / Operating Cash Flow Ratio | 89.22% | 78.97% | 84.97% |
Bio-Techne's cash flow metrics reflect strong capital efficiency, which optimizes growth potential and ensures robust dividend coverage. The CAPEX spending remains within controllable limits, facilitating consistent cash flow sufficiency for dividends.
Balance Sheet & Leverage Analysis
The balance sheet analysis portrays a picture of financial stability, vital for maintaining investor confidence and sustaining long-term growth. Bio-Techne's leverage ratios indicate healthy debt management and liquidity positions.
| Metric | 2025 | 2024 | 2023 |
|---|---|---|---|
| Debt-to-Equity | 23.14% | 20.28% | 23.14% |
| Debt-to-Assets | 17.36% | 15.52% | 17.24% |
| Debt-to-Capital | 18.79% | 16.86% | 18.79% |
| Net Debt to EBITDA | 1.30 | 0.86 | 0.60 |
| Current Ratio | 3.46 | 3.87 | 4.84 |
| Quick Ratio | 2.38 | 2.75 | 3.50 |
| Financial Leverage | 1.33 | 1.31 | 1.34 |
The leverage ratios underscore Bio-Techne's debt management, indicating a well-structured balance sheet that promotes financial agility and liquidity for ongoing operations and growth endeavors.
Fundamental Strength & Profitability
Fundamental strength and profitability assessments are instrumental in evaluating the ability of Bio-Techne to sustain growth and generate shareholder value. The company's profitability metrics remain strong, showcasing consistent R&D investment without sacrificing profitability.
| Metric | 2025 | 2024 | 2023 |
|---|---|---|---|
| Return on Equity | 3.83% | 8.13% | 14.51% |
| Return on Assets | 2.87% | 6.22% | 10.81% |
| Margins: Net | 6.02% | 14.50% | 25.10% |
| Margins: EBIT | 8.77% | 17.38% | 30.78% |
| Margins: EBITDA | 17.78% | 27.02% | 40.21% |
| Margins: Gross | 64.80% | 66.41% | 67.72% |
| R&D to Revenue | 8.16% | 8.34% | 8.14% |
Bio-Techne exhibits robust profitability indicators with significant returns on equity and assets, implying a profitable and growth-orientated business model. The consistently high margins reflect the company's competitive advantage and operational efficiency.
📉 Price Development
✅ Dividend Scoring System
| Metric | Score | Score Bar |
|---|---|---|
| Dividend yield | 2 | |
| Dividend Stability | 4 | |
| Dividend growth | 2 | |
| Payout ratio | 4 | |
| Financial stability | 5 | |
| Dividend continuity | 5 | |
| Cashflow Coverage | 4 | |
| Balance Sheet Quality | 5 |
Total Score: 31/40
🗳️ Rating
In conclusion, Bio-Techne Corporation has a stable, albeit low, dividend yield with a fundamental focus on sustainability rather than aggressive growth. This assessment is suitable for risk-averse investors prioritizing consistent returns. The company's robust financial stability and conservative payout strategy offer a reliable dividend profile, making it a suitable addition for long-term oriented portfolios.
Smart Data Insight
Master the Perfect Entry & Exit for this Stock
Don't leave your profits to chance. Historically, this stock follows specific seasonal patterns that institutional traders use to maximize returns.
- ✅ Identify the "Golden Buying Window"
- ✅ Avoid high-risk correction cycles
- ✅ Backtested data from the last 20+ years