October 13, 2025 a 12:46 pm


TECH: Dividend Analysis - Bio-Techne Corporation
Bio-Techne Corporation shows a modest dividend yield, supported by a stable dividend history. Its going concern is solidified by consistent performance and a remarkable financial stability. While dividend growth is absent, the company maintains a healthy payout ratio, indicating a strong financial discipline.
📊 Overview
Bio-Techne Corporation operates in the Biotech sector, offering a dividend yield of 0.60%. Its current dividend per share stands at $0.32, maintaining consistency with its 18-year dividend history. The company has had no recent cuts or suspensions, demonstrating reliability.
| Sector | Dividend Yield | Current Dividend Per Share | Dividend History | Last Cut or Suspension |
|---|---|---|---|---|
| Biotech | 0.60% | $0.32 | 18 years | None |
📉 Dividend History
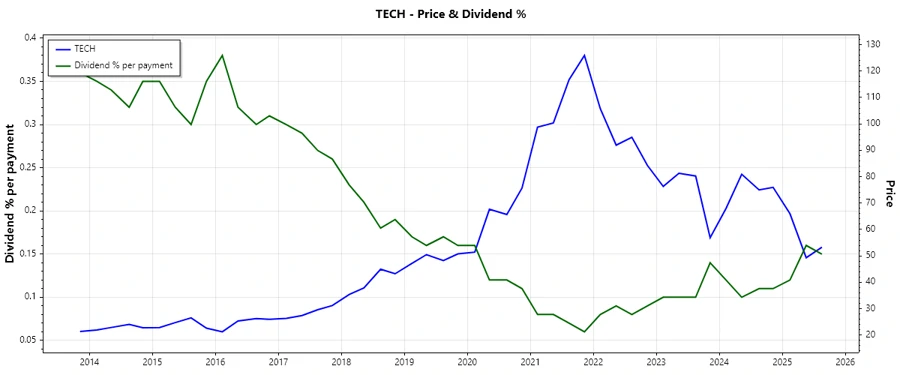
The dividend history reflects Bio-Techne's commitment to shareholder returns, emphasizing long-term stability through consistent payments. This consistency instills investor confidence.
| Year | Dividend per Share (USD) |
|---|---|
| 2025 | 0.24 |
| 2024 | 0.32 |
| 2023 | 0.32 |
| 2022 | 0.32 |
| 2021 | 0.32 |
📈 Dividend Growth
Despite a stagnation in dividend growth for the past 3 and 5 years, the lack of growth is counterbalanced by the company's enduring dividend history. The stability offers a positive perspective on Bio-Techne's financial health.
| Time | Growth |
|---|---|
| 3 years | 0% |
| 5 years | 0% |
The average dividend growth is 0% over 5 years. This shows moderate but steady dividend growth.
✅ Payout Ratio
The payout ratio is a critical measure of dividend sustainability. Bio-Techne's EPS-based payout ratio is 67.52%, and the free cash flow-based ratio is 19.64%. These ratios suggest that dividends are well-covered by both earnings and cash flow, promoting sustainable payouts.
| Key Figure | Ratio |
|---|---|
| EPS-based | 67.52% |
| Free Cash Flow-based | 19.64% |
📊 Cashflow & Capital Efficiency
Evaluating cash flow and capital efficiency highlights the company's ability to generate cash and manage investments effectively. Comparisons over recent years indicate robust cash management.
| Metric | 2025 | 2024 | 2023 |
|---|---|---|---|
| Free Cash Flow Yield | 3.17% | 2.09% | 1.68% |
| Earnings Yield | 0.91% | 1.49% | 2.22% |
| CAPEX to Operating Cash Flow | 10.78% | 21.03% | 15.03% |
| Stock-based Compensation to Revenue | 3.35% | 3.28% | 3.45% |
| Free Cash Flow / Operating Cash Flow Ratio | 89.22% | 78.97% | 84.97% |
The company's free cash flow efficiency and moderate CAPEX spending reflect prudent capital allocation, promoting sustained financial health.
🗣️ Balance Sheet & Leverage Analysis
A strong balance sheet is vital for business stability. Bio-Techne has maintained low leverage levels, supporting financial flexibility.
| Metric | 2025 | 2024 | 2023 |
|---|---|---|---|
| Debt-to-Equity | 0.2314 | 0.2028 | 0.2314 |
| Debt-to-Assets | 0.1736 | 0.1552 | 0.1724 |
| Debt-to-Capital | 0.1880 | 0.1686 | 0.1879 |
| Net Debt to EBITDA | 1.26 | 0.86 | 0.60 |
| Current Ratio | 3.46 | 3.87 | 4.84 |
| Quick Ratio | 2.38 | 2.75 | 3.50 |
| Financial Leverage | 1.33 | 1.31 | 1.34 |
Bio-Techne's conservative debt levels and strong liquidity ratios highlight its financial prudence, ensuring operational adaptability and reduced risk.
📈 Fundamental Strength & Profitability
Profitability ratios such as ROE, ROA, and margins highlight Bio-Techne's efficiency in utilizing its resources, critical for sustained growth.
| Metric | 2025 | 2024 | 2023 |
|---|---|---|---|
| Return on Equity | 3.82% | 8.13% | 14.51% |
| Return on Assets | 2.87% | 6.22% | 10.81% |
| Net Margin | 6.02% | 14.50% | 25.10% |
| EBIT Margin | 8.77% | 17.38% | 30.78% |
| EBITDA Margin | 17.78% | 26.78% | 40.52% |
| Gross Margin | 64.80% | 66.41% | 67.72% |
| Research & Development to Revenue | 8.16% | 8.34% | 8.14% |
Bio-Techne demonstrates strong profitability performance, underpinned by effective use of equity and assets, alongside well-maintained margins.
🔍 Price Development
🏆 Dividend Scoring System
| Criteria | Score | Score Bar |
|---|---|---|
| Dividend yield | 2 | |
| Dividend Stability | 5 | |
| Dividend growth | 1 | |
| Payout ratio | 4 | |
| Financial stability | 5 | |
| Dividend continuity | 5 | |
| Cashflow Coverage | 4 | |
| Balance Sheet Quality | 5 |
Total Score: 31 / 40
🗣️ Rating
Bio-Techne Corporation exhibits robust financial stability and a consistent dividend history, though its growth in dividends is static. With a strong balance sheet and proficient cash flow management, this company stands out as a reliable income investment with certain growth potential.
Smart Data Insight
Master the Perfect Entry & Exit for this Stock
Don't leave your profits to chance. Historically, this stock follows specific seasonal patterns that institutional traders use to maximize returns.
- ✅ Identify the "Golden Buying Window"
- ✅ Avoid high-risk correction cycles
- ✅ Backtested data from the last 20+ years