May 24, 2025 a 03:30 am


TECH: Dividend Analysis - Bio-Techne Corporation
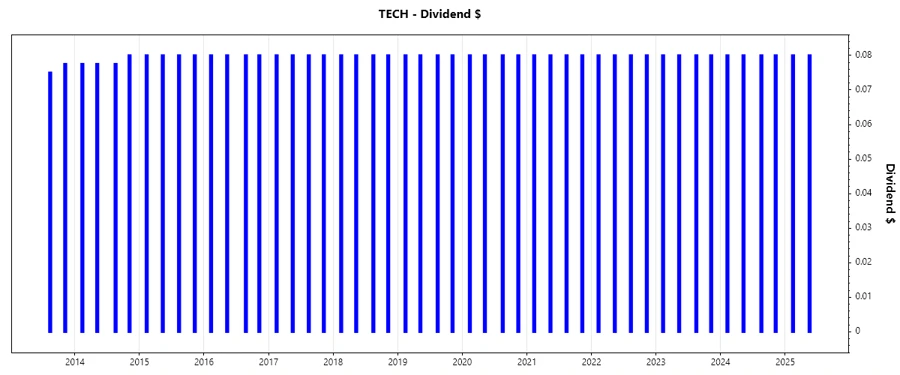
Bio-Techne Corporation exhibits a modest dividend yield with a notable 18-year history, underscoring its commitment to returning value to shareholders through a consistent dividend policy. Despite the lack of recent dividend growth, the company's stable payout signifies a reliable income stream for investors. A deeper dive into their payout ratios and cash flow generation indicates a well-managed approach to balancing reinvestment needs with shareholder returns.
📊 Overview
Bio-Techne operates in a specialized sector with a current dividend yield of 0.65%. This yield, accompanied by a current dividend per share of $0.32 and a remarkable 18-year dividend history, reflects its stable financial base. The company has not experienced a recent dividend cut or suspension, indicating reliability.
| Sector | Dividend Yield | Current Dividend Per Share (USD) | Dividend History (Years) | Last Cut or Suspension |
|---|---|---|---|---|
| Biotechnology | 0.65% | 0.32 | 18 | None |
🗣️ Dividend History
The dividend history is a crucial indicator of a company's long-term financial health and policy consistency. Bio-Techne has maintained a consistent dividend distribution over 18 years, which reassures investors seeking stable income from their investments.
| Year | Dividend Per Share (USD) |
|---|---|
| 2025 | 0.16 |
| 2024 | 0.32 |
| 2023 | 0.32 |
| 2022 | 0.32 |
| 2021 | 0.32 |
📈 Dividend Growth
Although Bio-Techne has not demonstrated dividend growth over the past 3 and 5 years, the consistent dividend payments reflect a strong commitment to providing shareholder value. It is important to monitor these metrics as they indicate the potential for future income increases.
| Time | Growth |
|---|---|
| 3 years | 0 % |
| 5 years | 0 % |
The average dividend growth is 0% over 5 years. This shows moderate but steady dividend growth.
⚠️ Payout Ratio
The payout ratio gauges a company's capability to sustain dividend payments. An EPS-based payout ratio of 38.21% and an FCF-based ratio of 22.70% suggest that Bio-Techne efficiently manages its earnings and cash flows, providing a solid cushion for continued dividend distributions.
| Key Figure | Ratio |
|---|---|
| EPS-based | 38.21 % |
| Free Cash Flow-based | 22.70 % |
With manageable payout ratios, Bio-Techne maintains ample flexibility for reinvestment and dividend stability, positioning itself to weather potential fiscal challenges.
✅ Cashflow & Capital Efficiency
Evaluating cash flow and capital efficiency provides insights into operational proficiency. Bio-Techne's metrics indicate reasonable returns on their utilized capital, underscoring their core strategy of enhancing shareholder value through optimized capital allocation.
| Metric | 2024 | 2023 | 2022 |
|---|---|---|---|
| Free Cash Flow Yield | 2.09% | 1.68% | 2.06% |
| Earnings Yield | 1.49% | 2.22% | 2.00% |
| CAPEX to Operating Cash Flow | 21.03% | 15.03% | 13.81% |
| Stock-based Compensation to Revenue | 3.28% | 3.45% | 3.81% |
| Free Cash Flow / Operating Cash Flow Ratio | 78.97% | 84.97% | 86.19% |
The company's stability in cash flow generation and commendable capital efficiency fortify its financial positioning, which in turn bodes well for future profitability and dividend security.
📉 Balance Sheet & Leverage Analysis
Analyzing the balance sheet uncovers Bio-Techne's financial resilience. Their debt levels relative to equity and assets suggest a prudent approach to leverage, which enhances financial stability and reduces business risk.
| Metric | 2024 | 2023 | 2022 |
|---|---|---|---|
| Debt-to-Equity | 20.28% | 23.14% | 19.16% |
| Debt-to-Assets | 15.52% | 17.24% | 14.20% |
| Debt-to-Capital | 16.86% | 18.79% | 16.08% |
| Net Debt to EBITDA | 0.86 | 0.60 | 0.37 |
| Current Ratio | - | - | - |
| Quick Ratio | 2.75 | 3.50 | 2.64 |
| Financial Leverage | 1.31 | 1.34 | 1.35 |
The strength of Bio-Techne's balance sheet is evident through its conservative leverage and robust financial ratios, which contribute to its capacity to maintain dividend payouts under various market conditions.
📊 Fundamental Strength & Profitability
Profitability indicators reveal Bio-Techne's operational effectiveness. The company shows respectable returns on equity and assets, reflecting capable management and efficient use of resources.
| Metric | 2024 | 2023 | 2022 |
|---|---|---|---|
| Return on Equity | 6.34% | 14.51% | 15.99% |
| Return on Assets | 4.98% | 10.81% | 11.86% |
| Margins: Net | 14.50% | 25.10% | 24.61% |
| EBIT | 17.38% | 30.78% | 28.28% |
| EBITDA | 26.78% | 40.52% | 37.99% |
| Gross | 66.41% | 67.72% | 68.42% |
| R&D to Revenue | 8.06% | 8.14% | 7.88% |
Bio-Techne's strong profitability metrics endorse its strategic ingenuity and industry positioning, enabling continued reinvestment and potential for future shareholder return enhancements.
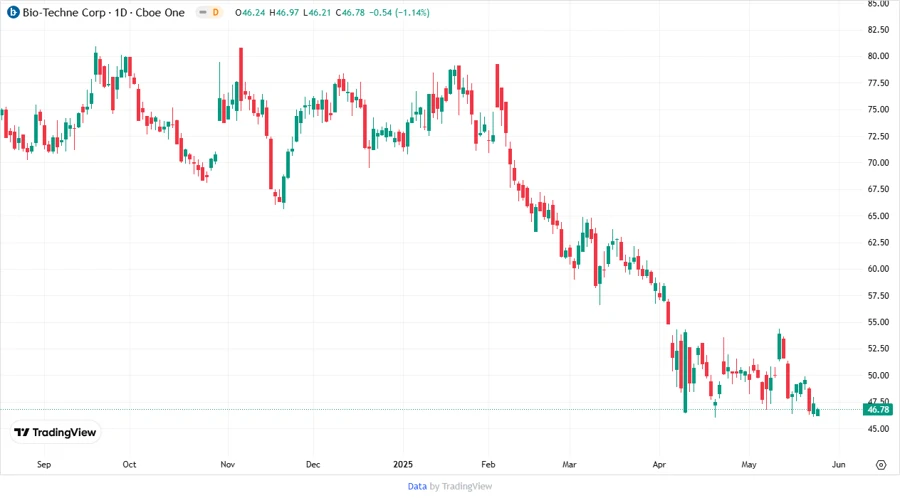
🔍 Price Development
🌟 Dividend Scoring System
| Criteria | Score | Score Bar |
|---|---|---|
| Dividend yield | 3 | |
| Dividend Stability | 4 | |
| Dividend growth | 2 | |
| Payout ratio | 4 | |
| Financial stability | 5 | |
| Dividend continuity | 5 | |
| Cashflow Coverage | 3 | |
| Balance Sheet Quality | 5 |
Total Score: 31 out of 40
📋 Rating
Bio-Techne Corporation holds a robust dividend profile with commendable score across financial stability and balance sheet quality. Despite the lack of recent dividend growth, its history and consistency in payouts provide reassurance for steady income streams. This positions the stock as a viable candidate for dividend-focused investors seeking stability in the biotechnology sector.
Smart Data Insight
Master the Perfect Entry & Exit for this Stock
Don't leave your profits to chance. Historically, this stock follows specific seasonal patterns that institutional traders use to maximize returns.
- ✅ Identify the "Golden Buying Window"
- ✅ Avoid high-risk correction cycles
- ✅ Backtested data from the last 20+ years