May 16, 2026 a 08:15 am
TDY: Trend and Support & Resistance Analysis - Teledyne Technologies Incorporated
The recent performance of Teledyne Technologies Incorporated shows significant fluctuations within the analyzed period. The stock displays tendencies that align with both upward and downward movements, indicating potential for both bullish and bearish investors. Despite market volatility, Teledyne remains a crucial player in industrial growth technologies, making it a valuable consideration for diversified portfolios.
Trend Analysis
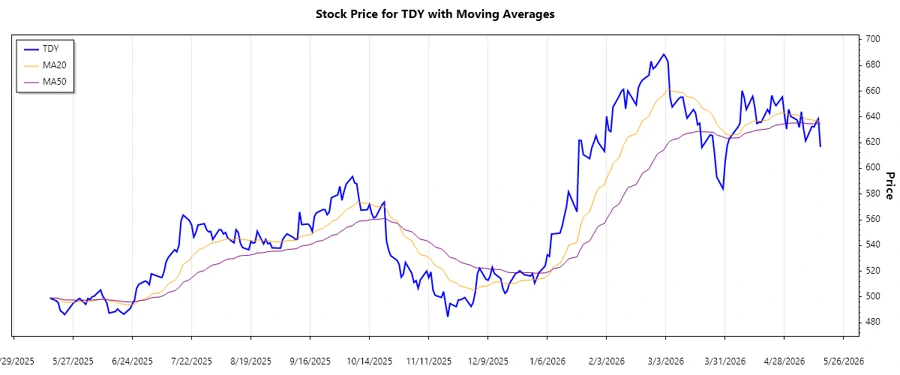
Analyzing the daily price data for Teledyne Technologies (TDY), we observe the presence of a prominent trend. By calculating the Exponential Moving Averages (EMA), we can gauge a reliable trend direction. The computed EMA20 and EMA50 show a general overview of the stock's recent behavior, assisting us to identify trend direction.
| Date | Close Price | Trend |
|---|---|---|
| 2026-05-15 | 616.58 | ▼ |
| 2026-05-14 | 638.56 | ▲ |
| 2026-05-13 | 635.96 | ▼ |
| 2026-05-12 | 632.17 | ▼ |
| 2026-05-11 | 632.58 | ▲ |
| 2026-05-08 | 621.38 | ▼ |
| 2026-05-07 | 630.78 | ▲ |
The analysis of the EMA reveals that the 20-day EMA has recently crossed the 50-day EMA from above, indicating a potential shift towards a bearish trend. The depicted fluctuations suggest an opportunity for short-term trading based on market sentiment swings.
Support and Resistance
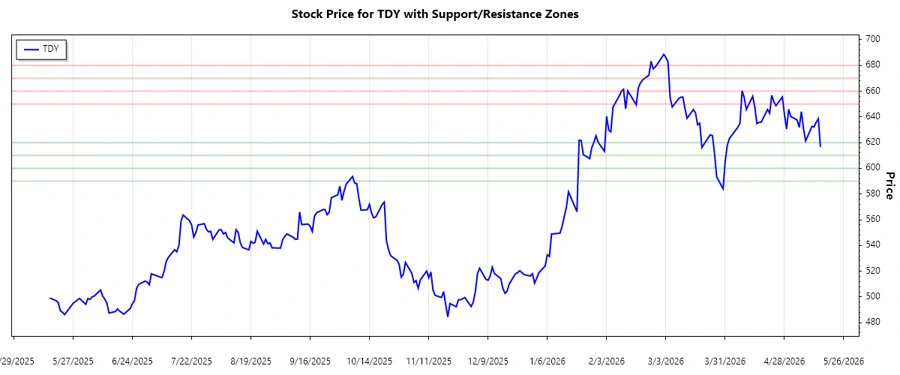
Key support and resistance levels provide insights into critical price levels where the stock might rebound or face hurdles. Using historical closing prices, we identify the following zones:
| Type | From | To |
|---|---|---|
| Support 1 | 610.00 | 620.00 |
| Support 2 | 590.00 | 600.00 |
| Resistance 1 | 650.00 | 660.00 |
| Resistance 2 | 670.00 | 680.00 |
Currently, the stock trades around the identified support level of 610.00 – 620.00, which may cushion it temporarily. Investors should monitor these zones for breakout or bounce opportunities.
Conclusion
Teledyne Technologies Incorporated navigates a period of volatile movements with both opportunities and risks in sight. A bearish trend seems to emerge as indicated by the EMA analysis, hinting at cautious trading. However, firm support levels offer potential for steady rebounds, and upside resistance zones may challenge any upward momentum. Investors need to weigh these technical insights against broader market conditions, as well as operational performance from Teledyne's diversified business model, which underpins its long-term growth potential.
### JSON Output
Smart Data Insight
Master the Perfect Entry & Exit for this Stock
Don't leave your profits to chance. Historically, this stock follows specific seasonal patterns that institutional traders use to maximize returns.
- ✅ Identify the "Golden Buying Window"
- ✅ Avoid high-risk correction cycles
- ✅ Backtested data from the last 20+ years