May 13, 2026 a 02:03 pm

TDY: Trend and Support & Resistance Analysis - Teledyne Technologies Incorporated
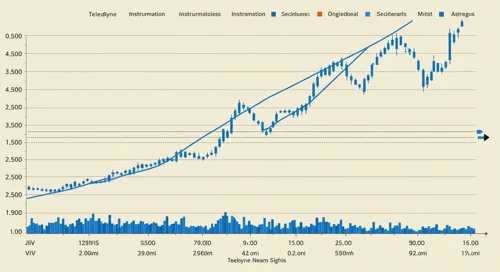
Teledyne Technologies Incorporated has shown robust performance across various industrial growth markets, leveraging its advanced technology in the instrumentation, digital imaging, aerospace, and defense segments. With historical price data reflecting fluctuations, the company's resilience is evident. The technical trend suggests possible opportunities for investors but the market conditions remain competitive.
Trend Analysis
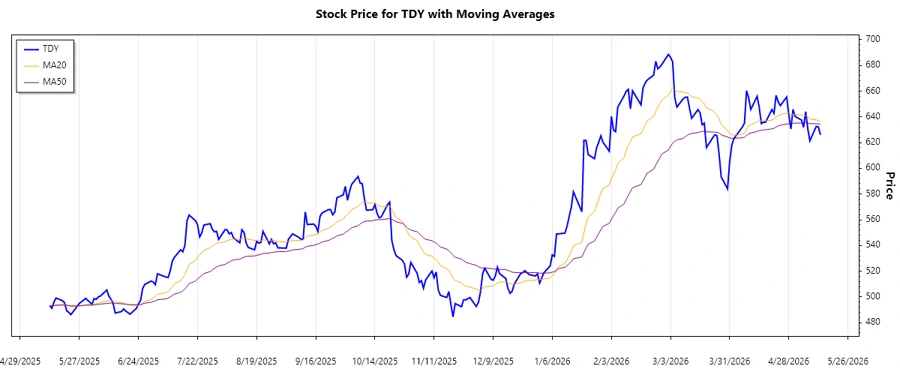
The analysis of Teledyne Technologies Incorporated displays recent movements in stock price, calculated EMAs, and identified the prevailing trend. By computing the 20-day EMA and 50-day EMA, a clearer picture of the current trend emerges.
| Date | Close Price | Trend |
|---|---|---|
| 2026-05-13 | $626.04 | ⚖️ |
| 2026-05-12 | $632.17 | ⚖️ |
| 2026-05-11 | $632.58 | ⚖️ |
| 2026-05-08 | $621.38 | ⚖️ |
| 2026-05-07 | $630.78 | ⚖️ |
| 2026-05-06 | $644.13 | ⚖️ |
| 2026-05-05 | $631.87 | ⚖️ |
The technical analysis suggests a sideways trend, given that the EMA20 is approximately equal to the EMA50, indicating indecision among market participants.
Support and Resistance
The stock has shown defined support and resistance zones. Calculating these key levels can prove essential in determining potential breakout or reversal points.
| Zone | From | To |
|---|---|---|
| Support 1 | ◀️ $620.00 | $625.00 |
| Support 2 | ◀️ $600.00 | $610.00 |
| Resistance 1 | $640.00 | ▶️ $650.00 |
| Resistance 2 | $660.00 | ▶️ $670.00 |
Currently, the stock price is in the Support 1 zone, suggesting potential accumulation. If it holds, this could mean a rebound; if it breaks, a move to Support 2 might follow.
Conclusion
The analysis reveals that Teledyne's stock is currently in a sideways trend, reflecting market indecision. The support and resistance zones imply potential volatility and trading opportunities. Investors may see slight risks with the possibility of further movement within the current support zone or a breakout to higher resistance levels. Technically, the market waits for sentiment that will push for a stronger directional trend, making it crucial for investors to monitor upcoming economic indicators closely.
Smart Data Insight
Master the Perfect Entry & Exit for this Stock
Don't leave your profits to chance. Historically, this stock follows specific seasonal patterns that institutional traders use to maximize returns.
- ✅ Identify the "Golden Buying Window"
- ✅ Avoid high-risk correction cycles
- ✅ Backtested data from the last 20+ years