October 06, 2025 a 09:03 am
TDY: Trend and Support & Resistance Analysis - Teledyne Technologies Incorporated
Teledyne Technologies Incorporated has demonstrated a resilient performance in its industrial growth markets, supported by its diverse product offerings and expansive geographical footprint. Its stock has witnessed considerable movement in the past months, reflecting broader market trends and investor sentiments. Understanding the technical trend and identifying critical support and resistance zones can provide clearer insights into potential investment opportunities or risks. In this analysis, we delve into recent trends and key technical indicators to better understand where the stock might head next.
Trend Analysis
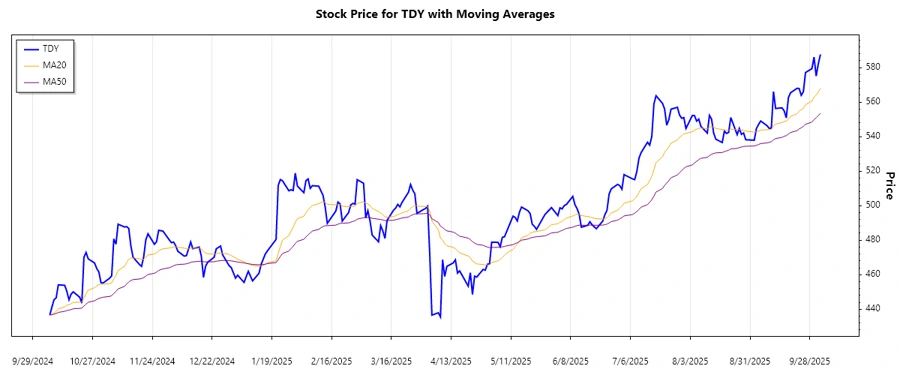
Analyzing the daily price data for Teledyne Technologies, we calculated the 20-day and 50-day Exponential Moving Averages (EMAs) to check the current trend. Current analysis shows:
| Date | Close Price | Trend |
|---|---|---|
| 2025-10-03 | 587.62 | ▲ |
| 2025-10-02 | 582.17 | ▲ |
| 2025-10-01 | 575.07 | ▲ |
| 2025-09-30 | 586.04 | ▲ |
| 2025-09-29 | 579.35 | ▲ |
| 2025-09-26 | 577.11 | ▲ |
| 2025-09-25 | 566.00 | ▲ |
The recent trend indicates a bullish move driven primarily by an increasing EMA20 above EMA50, signifying an uptrend. This may hint at potential bullish momentum continuing in the short term provided market conditions remain stable.
Support and Resistance
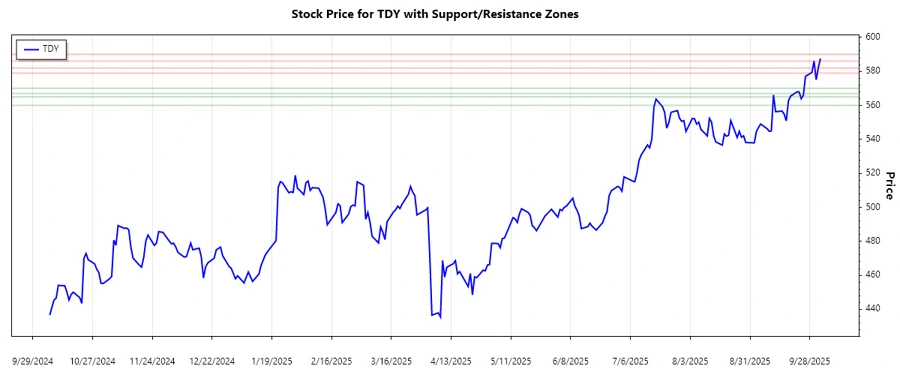
Based on historical data, we identified key support and resistance zones that may serve as important technical levels for TDY:
| Zone Type | Zone From | Zone To |
|---|---|---|
| Resistance 1 | 586.00 | 590.00 |
| Resistance 2 | 579.00 | 582.00 |
| Support 1 | 567.00 | 570.00 |
| Support 2 | 560.00 | 565.00 |
The current stock price of 587.62 is approaching the first resistance zone. Investors should watch for a breakout or retracement at this level. In case of a strong uptrend continuation, surpassing this zone could drive the stock higher.
Conclusion
Teledyne Technologies Incorporated has shown a promising uptrend noted by the recent lifting of its EMA20 above the EMA50. The stock has potential room for growth, especially if it can break past its resistance level. However, investors should remain vigilant for any signs of resistance-based pullbacks. Longer-term success will depend on the company’s performance in its target markets and broader economic conditions. Monitoring technical indicators alongside fundamental insights is advisable to navigate this stock effectively.
Smart Data Insight
Master the Perfect Entry & Exit for this Stock
Don't leave your profits to chance. Historically, this stock follows specific seasonal patterns that institutional traders use to maximize returns.
- ✅ Identify the "Golden Buying Window"
- ✅ Avoid high-risk correction cycles
- ✅ Backtested data from the last 20+ years