December 14, 2025 a 02:03 pm
TDG: Trend and Support & Resistance Analysis - TransDigm Group Incorporated
TransDigm Group Incorporated, a notable player in the aviation components market, is showcasing technical indicators that hint at its current market position. As a supplier of critical aircraft components, its stock experiences notable fluctuations reflecting broader economic and sector-specific developments. With the analysis of recent price data, we can provide insights into potential trends and key price zones.
Trend Analysis
| Date | Closing Price | Trend |
|---|---|---|
| 2025-12-12 | 1294.65 | ▼ Down |
| 2025-12-11 | 1317.49 | ⚖️ Neutral |
| 2025-12-10 | 1302.9 | ▼ Down |
| 2025-12-09 | 1318.02 | ▲ Up |
| 2025-12-08 | 1347.17 | ▲ Up |
| 2025-12-05 | 1346.86 | ▲ Up |
| 2025-12-04 | 1360.1 | ▲ Up |
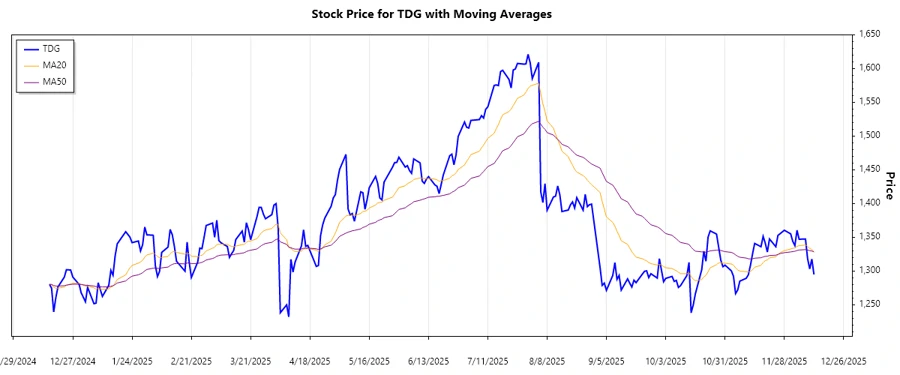
The recent analysis indicates a short-term upward trend as the EMA20 remains above the EMA50, suggesting a bullish market sentiment. This technical scenario implies potential for further gains provided the stock sustains its current momentum.
Support- and Resistance
| Zone Type | Range | Direction |
|---|---|---|
| Support Zone 1 | 1300 - 1320 | ▼ Support |
| Support Zone 2 | 1250 - 1270 | ▼ Support |
| Resistance Zone 1 | 1370 - 1390 | ▲ Resistance |
| Resistance Zone 2 | 1400 - 1420 | ▲ Resistance |
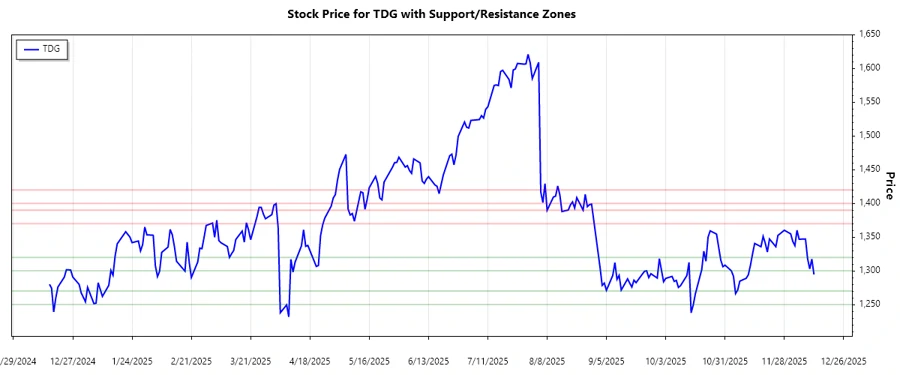
The stock is currently testing the first support zone between 1300 and 1320. A breach below this could propel it into the second support zone, whereas sustained buying pressure may push it towards resistance. This highlights critical decision points for investors.
Conclusion
TransDigm's stock is showing a bullish trajectory as indicated by the EMA trend analysis, suggesting a potential continuation of upward movement. Investors should be vigilant of the support levels that may serve as bounce-back points. However, the resistance zones identified could pose significant barriers to further growth. While opportunities for gains exist, investors should weigh these against potential risks stemming from broader market volatility.