October 12, 2025 a 02:03 pm### TDG: Trend and Support & Resistance Analysis - TransDigm Group Incorporated
 ### Trend Analysis
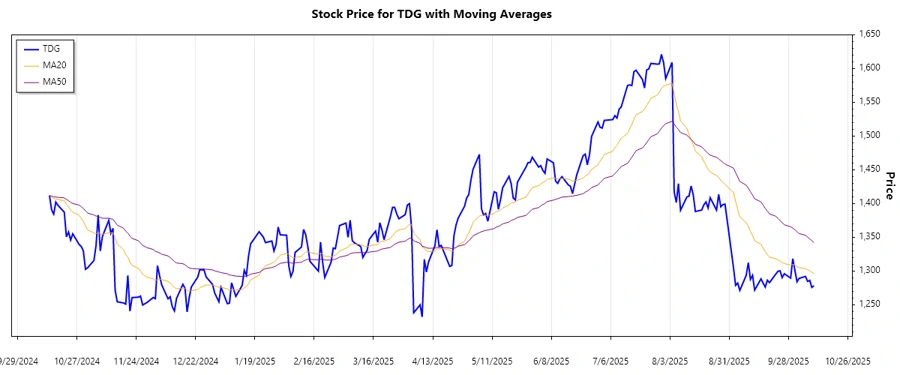
The calculated EMAs indicate a recent declining trend, as evidenced by EMA20 falling below EMA50. This suggests a bearish momentum in the short term.
 ### Support- and Resistance
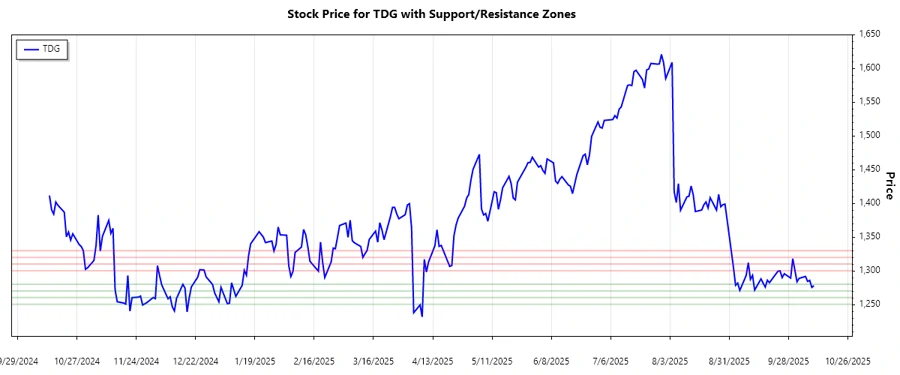
- Support Zones: 1250.5 - 1260.5, 1270.0 - 1280.0
- Resistance Zones: 1300.0 - 1310.0, 1320.0 - 1330.0
### Support- and Resistance
- Support Zones: 1250.5 - 1260.5, 1270.0 - 1280.0
- Resistance Zones: 1300.0 - 1310.0, 1320.0 - 1330.0
With current prices near the support zones, potential reversion could be anticipated upon strengthened buyer interest.
 ### Conclusion
The recent decline in TDG's price, reflected by the EMA crossover, shows bearish tendencies but support zones suggest potential stabilization points. Investors should be cautious of the current downtrend while monitoring for changes in momentum around critical support levels. A break above resistance could signal a shift towards bullish perspectives, contingent on volume and broader market conditions. As part of a dynamic sector, TDG offers opportunities but also bears risks linked to broader market volatilities and company-specific developments.
### Conclusion
The recent decline in TDG's price, reflected by the EMA crossover, shows bearish tendencies but support zones suggest potential stabilization points. Investors should be cautious of the current downtrend while monitoring for changes in momentum around critical support levels. A break above resistance could signal a shift towards bullish perspectives, contingent on volume and broader market conditions. As part of a dynamic sector, TDG offers opportunities but also bears risks linked to broader market volatilities and company-specific developments.
TransDigm Group Incorporated, engaged in aircraft component production and supply, has experienced varied market conditions as reflected in its recent stock price movements. The analysis shows a nuanced interplay of market forces with observable trending directions. Evaluating EMAs and established support/resistance zones will provide crucial insights for potential investment strategies.
| Date | Close Price | Trend |
|---|---|---|
| 2025-10-10 | 1277.99 | ▼ |
| 2025-10-09 | 1275.44 | ▼ |
| 2025-10-08 | 1285.85 | ▲ |
| 2025-10-07 | 1284.38 | ▲ |
| 2025-10-06 | 1291.74 | ▲ |
| 2025-10-03 | 1288.83 | ▲ |
| 2025-10-02 | 1283.81 | ▼ |
### Support- and Resistance
- Support Zones: 1250.5 - 1260.5, 1270.0 - 1280.0
- Resistance Zones: 1300.0 - 1310.0, 1320.0 - 1330.0
| Zone Type | From | To |
|---|---|---|
| Support | 1250.5 | 1260.5 |
| Support | 1270.0 | 1280.0 |
| Resistance | 1300.0 | 1310.0 |
| Resistance | 1320.0 | 1330.0 |
### Conclusion
The recent decline in TDG's price, reflected by the EMA crossover, shows bearish tendencies but support zones suggest potential stabilization points. Investors should be cautious of the current downtrend while monitoring for changes in momentum around critical support levels. A break above resistance could signal a shift towards bullish perspectives, contingent on volume and broader market conditions. As part of a dynamic sector, TDG offers opportunities but also bears risks linked to broader market volatilities and company-specific developments.
Smart Data Insight
Master the Perfect Entry & Exit for this Stock
Don't leave your profits to chance. Historically, this stock follows specific seasonal patterns that institutional traders use to maximize returns.
- ✅ Identify the "Golden Buying Window"
- ✅ Avoid high-risk correction cycles
- ✅ Backtested data from the last 20+ years