November 02, 2025 a 11:44 am

TDG: Fibonacci Analysis - TransDigm Group Incorporated
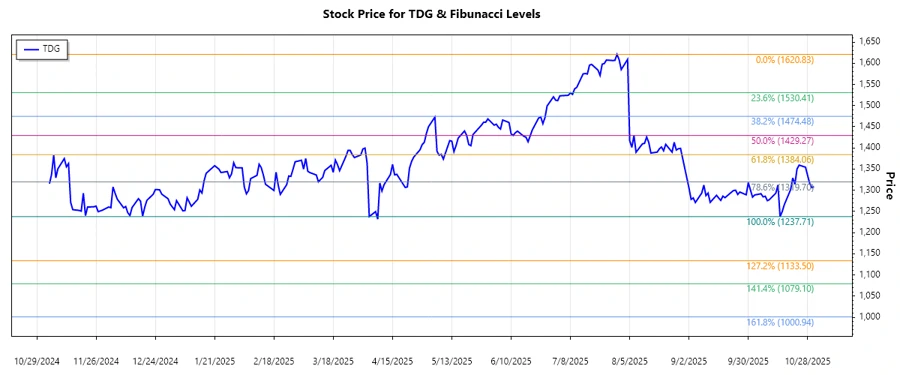
TransDigm Group Incorporated has recently been experiencing a general downward trend in its stock prices. The company is known for its advanced aircraft components and has a strong standing in the aerospace industry. This recent decline might be a reaction to broader economic conditions or industry-specific challenges. Investors should be cautious while assessing potential entry points, especially in a volatile market.
Fibonacci Analysis
| Details | Information |
|---|---|
| Start Date | 2025-07-30 |
| End Date | 2025-10-31 |
| High Point | $1,620.83 on 2025-07-30 |
| Low Point | $1,237.71 on 2025-10-15 |
| Fibonacci Level | Price Level |
|---|---|
| 0.236 | $1,319.58 |
| 0.382 | $1,375.69 |
| 0.5 | $1,429.27 |
| 0.618 | $1,482.85 |
| 0.786 | $1,558.26 |
The current stock price of $1,308.51 on 2025-10-31 is just below the 0.236 retracement level, indicating a potential area of resistance as the price tries to climb back up. This could technically serve as a resistance zone if the price remains below this level. Investors might want to watch if the price breaks above this level for potential upside momentum.
Conclusion
TransDigm Group's stock has been enduring a downward trend, presenting both risks and opportunities for investors. The current position near the Fibonacci 0.236 level might indicate a possible resistance point. If the stock can surpass this level, it could signal potential bullish momentum. However, failure to break this resistance might lead to further declines. Analysts should consider both macroeconomic factors and the company's market position while making investment recommendations.
Smart Data Insight
Master the Perfect Entry & Exit for this Stock
Don't leave your profits to chance. Historically, this stock follows specific seasonal patterns that institutional traders use to maximize returns.
- ✅ Identify the "Golden Buying Window"
- ✅ Avoid high-risk correction cycles
- ✅ Backtested data from the last 20+ years