
May 25, 2026 a 03:30 am
TDG: Dividend Analysis - TransDigm Group Incorporated
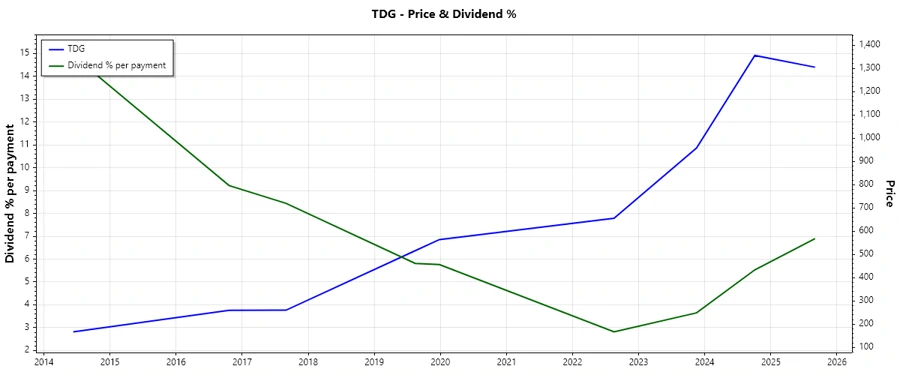
TransDigm Group Incorporated (TDG) showcases a robust dividend profile characterized by a relatively high yield coupled with disciplined management of capital allocation. The company exhibits sustainability through its established history of dividend payments and substantial growth. However, the recent suspension calls for cautious optimism.
📊 Overview
TransDigm Group Incorporated positions itself within the industrial sector, demonstrating a significant dividend yield much higher than the general market index. Its generous per-share payouts emerge from a strategy oriented toward shareholder returns despite the recent adjustments in its dividend scheme.
| Metric | Value |
|---|---|
| Sector | Industrial |
| Dividend yield | 12.64% |
| Current dividend per share | $165.45 |
| Dividend history | 11 years |
| Last cut or suspension | 2022 |
📈 Dividend History
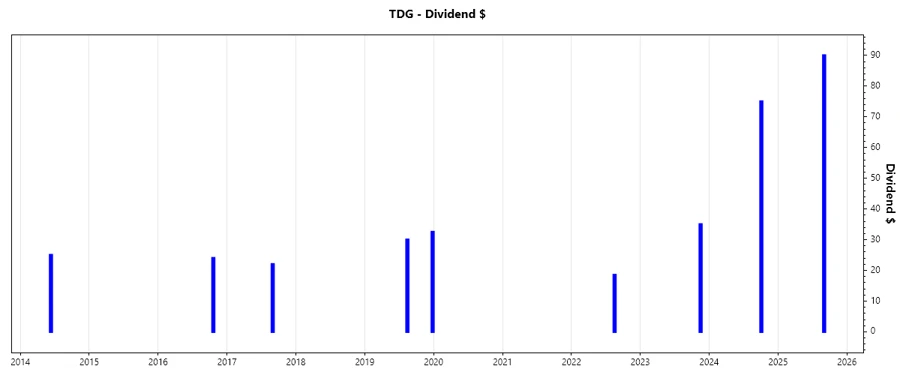
A strong dividend history reflects a company's commitment to returning capital to investors. It demonstrates the company's ability to sustain payouts amidst varying market conditions.
| Year | Dividend per Share (USD) |
|---|---|
| 2025 | $90.00 |
| 2024 | $75.00 |
| 2023 | $35.00 |
| 2022 | $18.50 |
| 2019 | $62.50 |
📊 Dividend Growth
Dividend growth serves as an indicator of the company's potential to increase shareholder returns. A consistent increase often leads to higher share prices and reinvestment opportunities.
| Time | Growth |
|---|---|
| 3 years | 0.69% |
| 5 years | 0.08% |
The average dividend growth is 0.08% over 5 years. This shows moderate but steady dividend growth.
📈 Payout Ratio
The payout ratio is crucial for evaluating whether a company’s earnings justify its dividend distributions. A high payout ratio could indicate future dividend reductions.
| Key figure | Ratio |
|---|---|
| EPS-based | 476% |
| Free cash flow-based | 500% |
With payout ratios significantly exceeding 100%, the current policy may be unsustainable without increasing earnings, risking future payouts.
💼 Cashflow & Capital Efficiency
Understanding the cash flow dynamics is vital for assessing operational efficiency and a company's ability to sustain dividends and growth investments.
| Metric | 2023 | 2024 | 2025 |
|---|---|---|---|
| Free Cash Flow Yield | 2.56% | 2.28% | 2.37% |
| Earnings Yield | 2.69% | 2.08% | 2.70% |
| CAPEX to Operating Cash Flow | 10.11% | 8.07% | 10.89% |
| Stock-based Compensation to Revenue | 2.38% | 2.73% | 1.78% |
| Free Cash Flow / Operating Cash Flow Ratio | 89.89% | 91.93% | 89.11% |
| Return on Invested Capital | 11.75% | 13.77% | 15.22% |
The company shows a significant ability to convert operating cash flows into free cash flows, underscoring a stable base for dividend payments.
⚖️ Balance Sheet & Leverage Analysis
Evaluating a company’s balance sheet ensures understanding of its capacity to weather fiscal uncertainties with effective debt management.
| Metric | 2023 | 2024 | 2025 |
|---|---|---|---|
| Debt-to-Equity | -9.96 | -3.96 | -3.10 |
| Debt-to-Assets | 0.99 | 0.97 | 1.31 |
| Debt-to-Capital | 1.11 | 1.34 | 1.48 |
| Net Debt to EBITDA | 5.18 | 4.89 | 5.89 |
| Current Ratio | 4.27 | 1.58 | 3.21 |
| Quick Ratio | 3.24 | 1.29 | 2.25 |
| Financial Leverage | -10.07 | -4.07 | -2.37 |
The negative leverage ratios indicate a risky fiscal posture, requiring careful monitoring of debt obligations compared to equity backing.
📈 Fundamental Strength & Profitability
Profitability metrics are critical for assessing the company’s operational efficiency and for forecasting sustained income levels.
| Metric | 2023 | 2024 | 2025 |
|---|---|---|---|
| Return on Equity | -65.42% | -27.25% | -21.41% |
| Return on Assets | 6.50% | 6.70% | 9.05% |
| Return on Invested Capital | 11.75% | 13.77% | 15.22% |
| Net Margin | 19.71% | 21.59% | 23.49% |
| EBIT Margin | 43.74% | 44.09% | 47.57% |
| EBITDA Margin | 47.81% | 48.02% | 51.73% |
| Gross Margin | 58.34% | 58.84% | 60.14% |
| R&D to Revenue | 0.00% | 0.00% | 0.00% |
Profit margins suggest robust operational control, but negative equity returns highlight heavy reliance on debt over equity.
📉 Price Development
⭐ Dividend Scoring System
| Criteria | Score | Visual |
|---|---|---|
| Dividend yield | 5 | |
| Dividend Stability | 3 | |
| Dividend growth | 2 | |
| Payout ratio | 1 | |
| Financial stability | 2 | |
| Dividend continuity | 4 | |
| Cashflow Coverage | 3 | |
| Balance Sheet Quality | 2 |
Total Score: 22/40
✅ Rating
TransDigm Group’s dividend profile is impressive on yield but strained in terms of payout sustainability, with notable leverage risk. Investors should weigh these factors carefully, favoring those primarily seeking income yield over stability.
Smart Data Insight
Master the Perfect Entry & Exit for this Stock
Don't leave your profits to chance. Historically, this stock follows specific seasonal patterns that institutional traders use to maximize returns.
- ✅ Identify the "Golden Buying Window"
- ✅ Avoid high-risk correction cycles
- ✅ Backtested data from the last 20+ years