January 15, 2026 a 03:31 pm

TDG: Dividend Analysis - TransDigm Group Incorporated
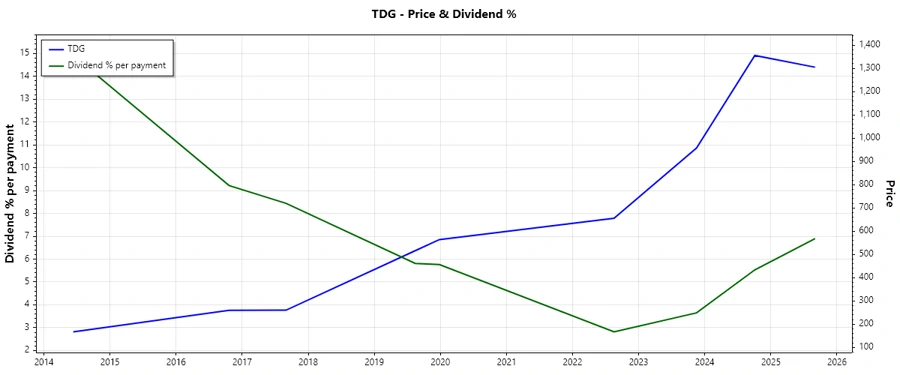
TransDigm Group Incorporated presents a compelling dividend profile with a significant yield of 12.64%, bolstered by an extensive dividend history spanning 11 years. Despite a previous cut in 2022, the company's robust market presence and specialized niche in the aerospace sector offer potential resilience in volatile markets.
📊 Overview
The aerospace sector continues to be a significant driver of economic growth, and TransDigm stands at the forefront with its substantial dividend yield of 12.64%. An impressive current dividend per share underscores its commitment to rewarding shareholders, even as the firm navigates industry challenges.
| Variable | Details |
|---|---|
| Sector | Aerospace |
| Dividend Yield | 12.64% |
| Current Dividend per Share | 165.45 USD |
| Dividend History | 11 years |
| Last Cut or Suspension | 2022 |
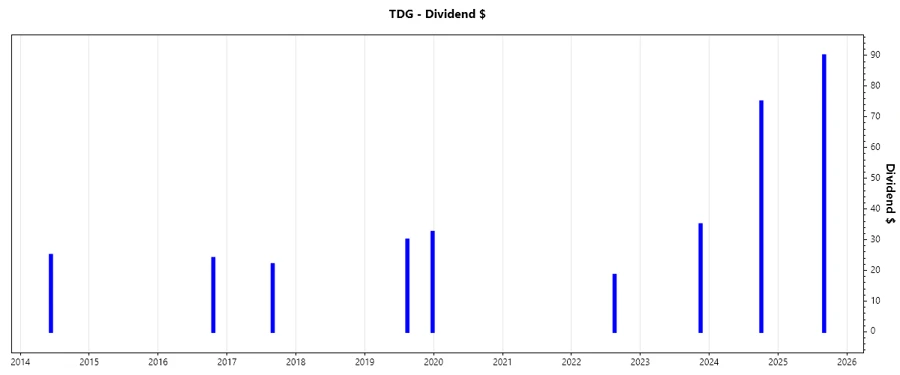
🗣️ Dividend History
The historical consistency in dividends from TransDigm demonstrates its financial resilience and governance focus. Understanding dividend patterns is crucial for assessing long-term payout sustainability.
| Year | Dividend per Share (USD) |
|---|---|
| 2025 | 90 |
| 2024 | 75 |
| 2023 | 35 |
| 2022 | 18.5 |
| 2019 | 62.5 |
📈 Dividend Growth
Sustainable dividend growth is a key indicator of a company’s financial health. TransDigm’s modest dividend growth of 0.69% over three years and 0.08% over five years reflects a conservative distribution strategy focusing on long-term stability.
| Time | Growth |
|---|---|
| 3 years | 0.69% |
| 5 years | 0.08% |
The average dividend growth is 0.08% over 5 years. This shows moderate but steady dividend growth.
✅ Payout Ratio
Payout ratios are crucial for assessing dividend sustainability. With EPS-based payout at 463.47% and free cash flow-based payout at 513.10%, these figures stress the aggressive nature of the current dividend payments, which may not be sustainable without profit growth.
| Key Figure | Ratio |
|---|---|
| EPS-based | 463.47% |
| Free cash flow-based | 513.10% |
A high payout ratio indicates a potential risk of overextending the company’s ability to maintain these dividends in challenging times.
Cashflow & Capital Efficiency
Assessing cash flow dynamics and capital efficiency is vital to understanding the operational liquidity and investment effectiveness of TransDigm. High CAPEX and stock-based compensation ratios could impact free cash flow margins.
| Metric | 2025 | 2024 | 2023 |
|---|---|---|---|
| Free Cash Flow Yield | 0.0237 | 0.0228 | 0.0256 |
| Earnings Yield | 0.0270 | 0.0208 | 0.0269 |
| CAPEX to Operating Cash Flow | 0.1089 | 0.0807 | 0.1011 |
| Stock-based Compensation to Revenue | 0.0178 | 0.0273 | 0.0238 |
| Free Cash Flow / Operating Cash Flow Ratio | 0.8911 | 0.9193 | 0.8990 |
The variation in free cash flow yield and CAPEX allocation requires strategic realignment to sustain longer-term operational efficiency.
Balance Sheet & Leverage Analysis
Leverage ratios reveal insights into financial risks. TransDigm's high debt-to-equity ratio negativizes corporate flexibility, potentially impacting its ability to sustain dividends amid market volatilities.
| Metric | 2025 | 2024 | 2023 |
|---|---|---|---|
| Debt-to-Equity | -3.1004 | -3.9585 | -9.9627 |
| Debt-to-Assets | 1.3108 | 0.9731 | 0.9898 |
| Debt-to-Capital | 1.4761 | 1.3380 | 1.1116 |
| Net Debt to EBITDA | 5.9593 | 4.8880 | 5.1760 |
| Current Ratio | 3.2136 | ||
| Quick Ratio | 2.2534 | 1.2862 | 3.2438 |
| Financial Leverage | -2.3652 | -4.0677 | -10.0655 |
The aggressive leverage metrics suggest a need for improved liquidity management to ensure ongoing financial stability.
Fundamental Strength & Profitability
TransDigm's profitability margins illustrate inherent operational efficiencies. However, negative return on equity highlights concerning profitability disparities.
| Metric | 2025 | 2024 | 2023 |
|---|---|---|---|
| Return on Equity | -0.2141 | -0.2725 | -0.6542 |
| Return on Assets | 0.0905 | 0.0670 | 0.0650 |
| Margins: Net | 0.2349 | 0.2159 | 0.1971 |
| EBIT | 0.4757 | 0.4409 | 0.4374 |
| EBITDA | 0.5173 | 0.4802 | 0.4781 |
| Gross | 0.6014 | 0.5884 | 0.5834 |
| R&D to Revenue | 0 | 0 | 0 |
Steady gross and EBIT margins signal operational efficiency, though the negative ROE warrants strategic realignments to boost profitability.
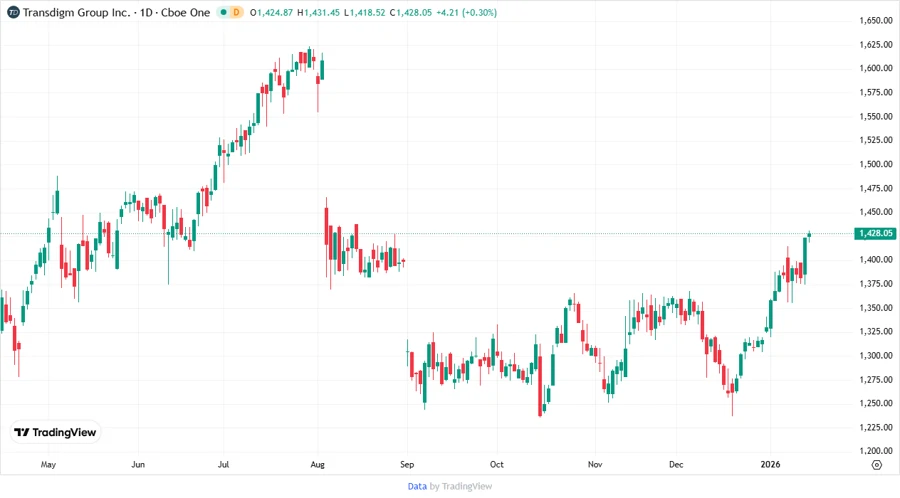
Price Development
⚠️ Dividend Scoring System
| Criteria | Score | |
|---|---|---|
| Dividend Yield | 5 | |
| Dividend Stability | 2 | |
| Dividend Growth | 1 | |
| Payout Ratio | 1 | |
| Financial Stability | 2 | |
| Dividend Continuity | 3 | |
| Cashflow Coverage | 2 | |
| Balance Sheet Quality | 2 |
Total Score: 18/40
📉 Rating
TransDigm Group Incorporated exhibits a high dividend yield, yet underlying financial strains from elevated payout ratios and leverage restrict its overall dividend attractiveness. Investors should weigh short-term yield benefits against potential risks in financial sustainability when considering TransDigm for their dividend portfolio strategy.