November 21, 2025 a 07:46 am
TDG: Dividend Analysis - TransDigm Group Incorporated
TransDigm Group Incorporated has showcased a unique dividend profile with a high current dividend per share. Despite recent fluctuations in growth, the company maintains an appealing dividend yield. Investors should note the elevated payout ratios, which might impact long-term dividend sustainability.
📊 Overview
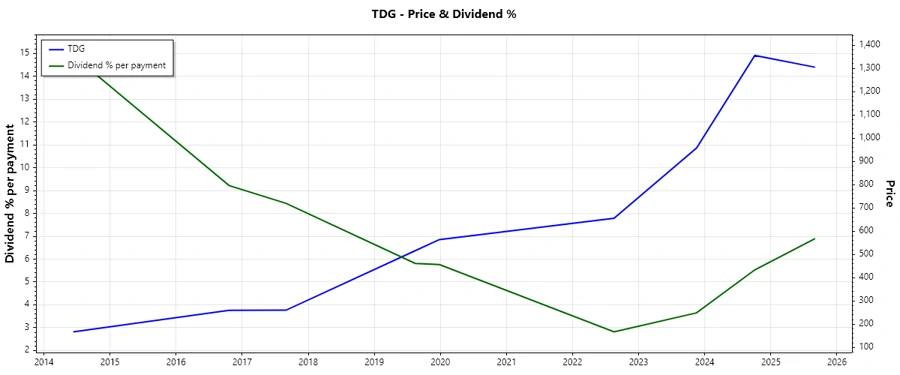
TransDigm Group is positioned in the market with a notable dividend yield and long-term dividend history. Despite recent economic challenges, the company remains committed to shareholder returns.
| Sector | Dividend Yield (%) | Current Dividend per Share (USD) | Dividend History (Years) | Last Cut or Suspension |
|---|---|---|---|---|
| Aerospace & Defense | 12.64% | $165 | 11 | 2022 |
🗣️ Dividend History
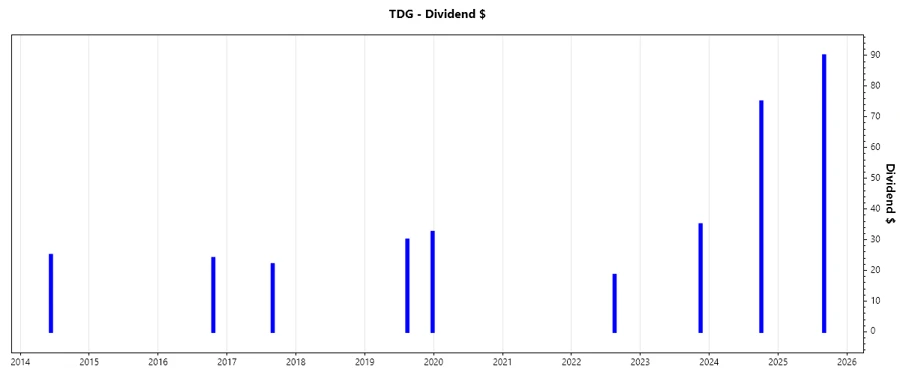
The historical dividend data reveals a strong commitment to disbursements, despite a cut in 2022. Stability in dividend payouts over the years is crucial for maintaining investor confidence.
| Year | Dividend per Share (USD) |
|---|---|
| 2025 | $90 |
| 2024 | $75 |
| 2023 | $35 |
| 2022 | $18.5 |
| 2019 | $62.5 |
📈 Dividend Growth
Dividend growth metrics offer insights into a company's capacity to increase returns to shareholders over time. Although recent growth has been moderate, it indicates a potential for stability.
| Time | Growth (%) |
|---|---|
| 3 years | 6.27% |
| 5 years | 3.71% |
The average dividend growth is 3.71% over 5 years. This shows moderate but steady dividend growth.
📉 Payout Ratio
Payout ratios help evaluate a company's ability to sustain its dividend payments. The elevated ratios may suggest potential financial strain.
| Key figure ratio | Value |
|---|---|
| EPS-based | 473.41% |
| Free cash flow-based | 487.55% |
The EPS-based payout of 473.41% and FCF-based payout of 487.55% indicate an overextension beyond earnings and cash flow, potentially risky for long-term investors.
✅ Cashflow & Capital Efficiency
Cash flow analysis provides insights into operational efficiency and capital management. Observe the free cash flow yield and its implications on sustainability.
| Metric | 2023 | 2024 | 2025 |
|---|---|---|---|
| Free Cash Flow Yield | 2.56% | 2.28% | 2.37% |
| Earnings Yield | 2.61% | 1.80% | 2.70% |
| CAPEX to Operating Cash Flow | 10.11% | 8.07% | 10.89% |
| Stock-based Compensation to Revenue | 2.38% | 2.73% | -1.78% |
| Free Cash Flow / Operating Cash Flow Ratio | 89.89% | 91.93% | 89.11% |
The data shows cautiously stable cash flows with moderate capital expenses relative to operating income. A promising signal for dividend viability.
⚠️ Balance Sheet & Leverage Analysis
Balanced leverage and debt metrics are essential for evaluating financial health. Analyzing ratios over the years provides insight into long-term viability.
| Metric | 2023 | 2024 | 2025 |
|---|---|---|---|
| Net Debt to EBITDA | 5.09 | 4.83 | -0.67 |
| Debt-to-Equity | -996.27% | -396.53% | 0% |
| Debt-to-Assets | 98.98% | 97.48% | 0% |
| Debt-to-Capital | 111.16% | 133.72% | 0% |
| Current Ratio | 426.73% | 158.21% | 0% |
| Quick Ratio | 324.38% | 128.62% | 0% |
| Financial Leverage | -1006.55% | -406.77% | 0% |
High leverage ratios in 2023 point to significant financial risks, suggesting potential liquidity challenges should the market conditions unfavorably shift.
📈 Fundamental Strength & Profitability
Analyzing profitability ratios provides insights into long-term growth prospects and shareholder value creation.
| Metric | 2023 | 2024 | 2025 |
|---|---|---|---|
| Return on Equity | -63.51% | -23.55% | 0% |
| Return on Assets | 6.31% | 5.79% | 9.05% |
| Return on Invested Capital | 12.00% | 14.15% | 14.34% |
| Net Margin | 19.13% | 18.66% | 23.49% |
| EBIT Margin | 44.59% | 44.85% | 47.57% |
| EBITDA Margin | 48.66% | 48.75% | 47.57% |
| Gross Margin | 56.96% | 57.48% | 60.14% |
| R&D to Revenue | 1.59% | 0% | 0% |
The fundamentals suggest moderate operational efficiency with promising margins. However, negative equity returns highlight a pressing need for strategic reshaping to improve profitability.
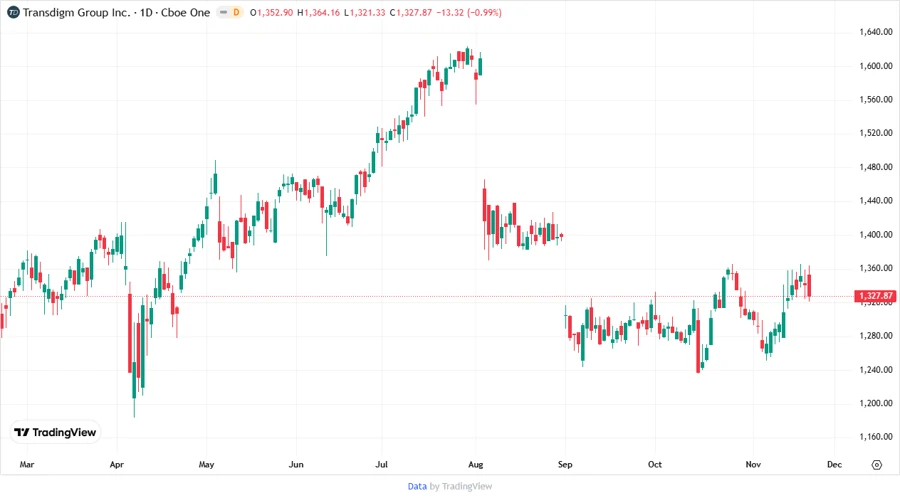
Price Development
Dividend Scoring System
This scoring system evaluates several dividend-related metrics, providing a comprehensive rating for perspective investors.
| Category | Score | Scale |
|---|---|---|
| Dividend yield | 4 | |
| Dividend Stability | 3 | |
| Dividend growth | 3 | |
| Payout ratio | 2 | |
| Financial stability | 2 | |
| Dividend continuity | 3 | |
| Cashflow coverage | 4 | |
| Balance Sheet Quality | 2 |
Overall Score: 23/40
🗣️ Rating
TransDigm Group stands with a robust dividend profile but is hindered by financial constraints as seen in its high payout ratios and negative financial leverages. While dividends remain attractive, potential investors should cautiously weigh the risks of liquidity challenges. A strategic improvement is essential for sustained long-term growth. Therefore, it receives a speculative hold recommendation contingent on market adjustments and strategic financial management enhancements.
Smart Data Insight
Master the Perfect Entry & Exit for this Stock
Don't leave your profits to chance. Historically, this stock follows specific seasonal patterns that institutional traders use to maximize returns.
- ✅ Identify the "Golden Buying Window"
- ✅ Avoid high-risk correction cycles
- ✅ Backtested data from the last 20+ years