
November 15, 2025 a 07:43 am

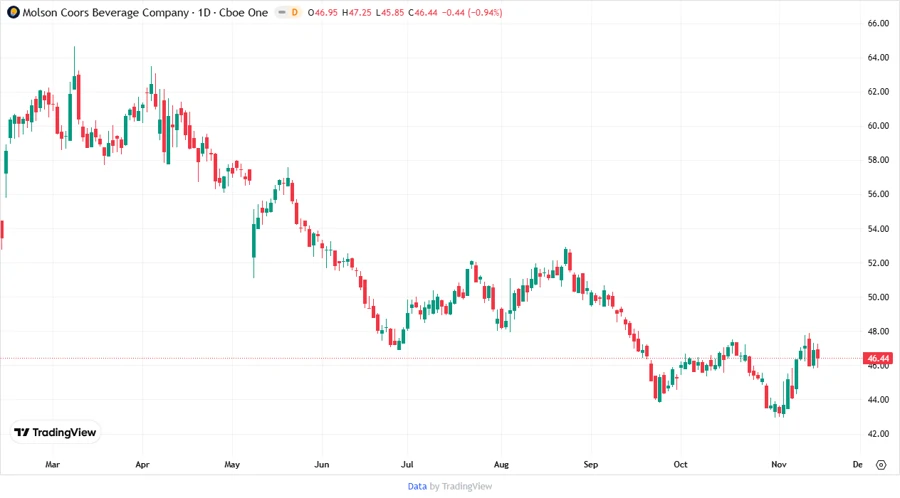
TAP: Fundamental Ratio Analysis - Molson Coors Beverage Company
The Molson Coors Beverage Company, with its long-standing legacy since 1774, showcases stability in a fluctuating market. With a diverse product portfolio, it caters to a wide demographic across multiple continents. Recent fundamental scores suggest steady performance, albeit with room for improvement in certain areas.
Fundamental Rating
Molson Coors demonstrates a solid overall score with particular strengths in discounted cash flow. However, there is a need for improvement in return endpoints to enhance competitiveness.
| Category | Score | Visualization |
|---|---|---|
| Discounted Cash Flow | 5 | |
| Return On Equity | 1 | |
| Return On Assets | 1 | |
| Debt To Equity | 2 | |
| Price To Earnings | 1 | |
| Price To Book | 4 |
Historical Rating
The historical ratings indicate progression in the company's overall score, reflecting slight improvements over the past scores.
| Date | Overall | DCF | ROE | ROA | D/E Ratio | P/E Ratio | P/B Ratio |
|---|---|---|---|---|---|---|---|
| 2025-11-14 | 2 | 5 | 1 | 1 | 2 | 1 | 4 |
| Past Score | 0 | 5 | 1 | 1 | 2 | 1 | 4 |
Analyst Price Targets
The price targets suggest a degree of optimism among analysts with a consensus around the mid-to-high 50s.
| High | Low | Median | Consensus |
|---|---|---|---|
| 65 | 48 | 51 | 53 |
Analyst Sentiment
With a balanced spread of buy and hold recommendations, the general sentiment reflects cautious optimism.
| Rating | Count | Visualization |
|---|---|---|
| Strong Buy | 0 | |
| Buy | 12 | |
| Hold | 20 | |
| Sell | 5 | |
| Strong Sell | 0 |
Conclusion
Molson Coors remains a prominent player with consistent product demand. The stability observed in core metrics presents an opportunity, but also highlights areas needing strategic focus, particularly in improving return metrics. Analyst sentiment offers a cautious but positive outlook, guided by stable price targets. However, mobility in industry trends and competitor advancements could impose risks that require agile management.
Smart Data Insight
Master the Perfect Entry & Exit for this Stock
Don't leave your profits to chance. Historically, this stock follows specific seasonal patterns that institutional traders use to maximize returns.
- ✅ Identify the "Golden Buying Window"
- ✅ Avoid high-risk correction cycles
- ✅ Backtested data from the last 20+ years