July 31, 2025 a 09:32 am


U.S. Sectors - Performance Analysis
The U.S. market sectors have experienced varied performance over different time periods, reflecting broader economic trends and investor sentiment. Understanding sector performance helps in identifying winners and laggards, offering insights into tactical asset allocation. Let's delve into the detailed analysis of each timeframe.
U.S. Sectors Performance One Week
📊 The past week witnessed modest volatility among U.S. sectors. Utilities emerged as the week's top performer, aligning with its defensive attributes in uncertain markets. Conversely, Transportation struggled, indicating potential concerns over economic growth. Technology and Energy offered mixed insights, with minor upticks suggesting selective investor optimism.
| Sector | Performance (%) | Performance |
|---|---|---|
| Utilities | 1.09 | |
| Technology | 1.25 | |
| Energy | 0.31 | |
| Retail | -0.21 | |
| Financial | -0.69 | |
| Healthcare | -1.16 | |
| Consumer Staples | -1.09 | |
| Communication | -2.02 | |
| Real Estate | -1.47 | |
| Industrial | -0.95 | |
| Material | -2.67 | |
| Transportation | -3.22 |
Performance chart for the one-week period.
U.S. Sectors Performance One Month
📈 Over a month, Technology has demonstrated significant strength, reflecting the sector's pivotal role in the economy. Utilities followed as strong performers, defending their place with stability. Conversely, Transportation shows prolonged struggles, indicating sector-specific headwinds. This divergence hints at a mixed macroeconomic landscape.
| Sector | Performance (%) | Performance |
|---|---|---|
| Technology | 5.36 | |
| Utilities | 3.99 | |
| Industrial | 2.69 | |
| Energy | 2.69 | |
| Real Estate | 1.14 | |
| Retail | 0.32 | |
| Financial | 0.13 | |
| Communication | -1.19 | |
| Healthcare | -1.78 | |
| Material | -1.27 | |
| Consumer Staples | -1.83 | |
| Transportation | -2.00 |
Performance chart for the one-month period.
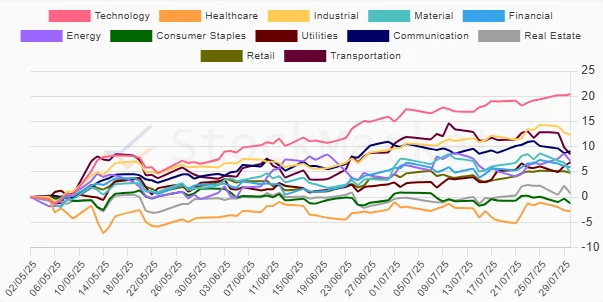
U.S. Sectors Performance Three Months
📈 Over the past three months, the Technology sector has soared, underlining its resilience and growth potential amidst challenges. Energy and Industrial sectors have also performed robustly, suggesting a possible cyclical recovery. In contrast, Healthcare lagged behind, raising concerns over its near-term outlook.
| Sector | Performance (%) | Performance |
|---|---|---|
| Technology | 20.39 | |
| Industrial | 12.34 | |
| Communication | 9.06 | |
| Transportation | 8.53 | |
| Energy | 7.16 | |
| Utilities | 6.86 | |
| Financial | 5.93 | |
| Retail | 4.81 | |
| Material | 4.79 | |
| Real Estate | 0.76 | |
| Consumer Staples | -1.22 | |
| Healthcare | -2.82 |
Performance chart for the three-month period.
Summary
✅ In conclusion, the diverse performance across U.S. sectors reflects varying economic conditions and investor sentiments. Technology remains resilient, leading growth narratives. Utilities have consistently shown defensive strength, while Transportation and Healthcare highlight vulnerabilities. Investors should focus on technology for growth and utilities for stability, while cautiously evaluating underperforming sectors for potential turnarounds.
Smart Data Insight
Master the Perfect Entry & Exit for this Stock
Don't leave your profits to chance. Historically, this stock follows specific seasonal patterns that institutional traders use to maximize returns.
- ✅ Identify the "Golden Buying Window"
- ✅ Avoid high-risk correction cycles
- ✅ Backtested data from the last 20+ years