
July 30, 2026 a 09:32 am

U.S. Sectors - Performance Analysis
Analyzing sectorial performances over different timescales provides vital insights into market dynamics. This analysis will delve into sector performances across one week, one month, and three months. We'll spotlight trends and provide strategic recommendations.
U.S. Sectors Performance One Week
📊 The weekly performance highlights notable rebounds in defensive sectors such as Consumer Staples and Communications. Meanwhile, cyclical sectors like Technology and Industrials have faced headwinds. This suggests an investor shift towards stability amid short-term market volatility.
| Sector | Performance (%) | Performance |
|---|---|---|
| Consumer Staples | 4.90 | |
| Communication | 3.87 | |
| Retail | 3.80 | |
| Healthcare | 2.96 | |
| Material | 2.88 | |
| Real Estate | 2.25 | |
| Financial | 1.54 | |
| Utilities | -2.79 | |
| Transportation | -2.77 | |
| Industrial | -2.88 | |
| Energy | -1.18 | |
| Technology | -6.82 |
U.S. Sectors Performance One Month
📈 The past month has seen strong performance from Energy and Financial sectors. Defensive sectors like Healthcare and Consumer Staples have also fared well. This indicates a more diversified interest, moving beyond traditional recession-proof stands.
| Sector | Performance (%) | Performance |
|---|---|---|
| Energy | 10.13 | |
| Financial | 5.68 | |
| Consumer Staples | 5.19 | |
| Healthcare | 4.82 | |
| Real Estate | 4.37 | |
| Communication | 2.38 | |
| Retail | 2.75 | |
| Material | 1.90 | |
| Utilities | -0.86 | |
| Transportation | -1.04 | |
| Industrial | -4.61 | |
| Technology | -13.09 |
U.S. Sectors Performance Three Months
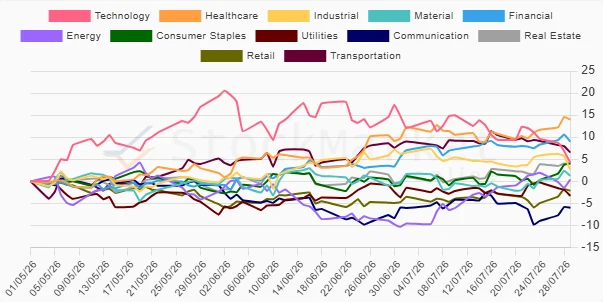
📈 Over the quarter, Healthcare and Transportation have emerged as the top gainers, indicating a healthy interest in growth and infrastructure-focused investments. Meanwhile, Communication and Retail have underperformed, reflecting consumer uncertainty.
| Sector | Performance (%) | Performance |
|---|---|---|
| Healthcare | 13.96 | |
| Transportation | 6.56 | |
| Financial | 9.01 | |
| Technology | 4.24 | |
| Consumer Staples | 4.08 | |
| Real Estate | 3.89 | |
| Industrial | 2.58 | |
| Material | 1.25 | |
| Energy | 0.35 | |
| Utilities | -3.27 | |
| Retail | -2.16 | |
| Communication | -5.99 |
Summary
💡 Diversifying across sectors has shown a range of performances, revealing the potential for strategic allocation shifts. Defensive sectors have demonstrated resilience, while select cyclical areas offer growth potential. Investors may benefit from maintaining balanced portfolios with a keen eye on economic indicators to navigate these varied market performances.
Smart Data Insight
Master the Perfect Entry & Exit for this Stock
Don't leave your profits to chance. Historically, this stock follows specific seasonal patterns that institutional traders use to maximize returns.
- ✅ Identify the "Golden Buying Window"
- ✅ Avoid high-risk correction cycles
- ✅ Backtested data from the last 20+ years