May 29, 2025 a 09:32 am


U.S. Sectors - Performance Analysis
📊 The analysis of U.S. sector performance over various timeframes reveals significant insights into market dynamics. Observations indicate differential performance across sectors and time periods, providing insights into both cyclical trends and defensive sector strategies. Let's delve deeper into the weekly, monthly, and quarterly performances of key sectors to understand prevailing market movements and strategic implications for investors.
U.S. Sectors Performance One Week
🔍 During the past week, the Real Estate sector emerged as the top performer with a growth of 1.67%, driven by favorable interest rate expectations. Conversely, the Retail sector underperformed, reflecting weak consumer demand with a decline of -0.20%. Notably, cyclicals such as Industrial and Communication showed robust performance, indicating market optimism. However, the marginal decline in sectors like Energy and Retail highlights sector-specific challenges. Overall, defensive versus cyclical sector performance was mixed.
| Sector | Performance (%) | Performance |
|---|---|---|
| Real Estate | 1.67 | |
| Communication | 1.15 | |
| Industrial | 0.93 | |
| Technology | 0.87 | |
| Healthcare | 0.73 | |
| Financial | 0.73 | |
| Transportation | 0.72 | |
| Consumer Staples | 0.60 | |
| Utilities | 0.55 | |
| Material | 0.19 | |
| Energy | -0.08 | |
| Retail | -0.20 |
U.S. Sectors Performance One Month
📈 Over the past month, the Technology sector saw the most significant gain at 10.31%, driven by strong earnings reports and investor enthusiasm. Conversely, Healthcare underperformed with a -5.48% decline, attributed to regulatory pressures. Cyclical sectors such as Industrial and Transportation showed robust growth, reflecting positive economic sentiment. Defensive sectors like Utilities and Consumer Staples experienced moderate growth, indicating stable demand amidst market volatility.
| Sector | Performance (%) | Performance |
|---|---|---|
| Technology | 10.31 | |
| Transportation | 9.53 | |
| Industrial | 9.15 | |
| Communication | 6.55 | |
| Financial | 3.96 | |
| Material | 3.13 | |
| Retail | 3.10 | |
| Utilities | 1.64 | |
| Consumer Staples | 0.72 | |
| Real Estate | 0.59 | |
| Energy | -1.15 | |
| Healthcare | -5.48 |
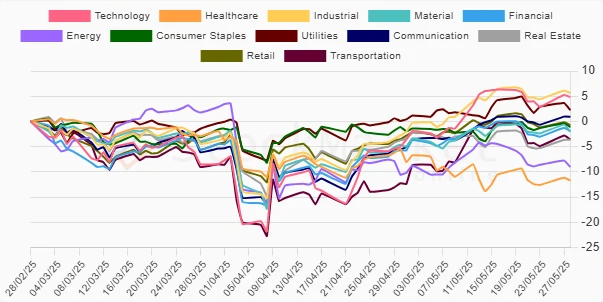
U.S. Sectors Performance Three Months
📉 The past three months have seen a mixed bag for U.S. sectors, with significant underperformance in Healthcare (-11.71%) due to ongoing policy uncertainties. Industrials and Technology sectors outperformed, evidencing continued investor confidence in growth and innovation. Defensive sectors like Utilities provided some stability with modest gains. However, the broader economic challenges are reflected in the negative performances of core sectors such as Energy and Materials.
| Sector | Performance (%) | Performance |
|---|---|---|
| Industrial | 5.65 | |
| Technology | 4.85 | |
| Utilities | 2.24 | |
| Communication | 0.93 | |
| Retail | -0.72 | |
| Consumer Staples | -1.10 | |
| Financial | -1.95 | |
| Material | -2.00 | |
| Transportation | -3.56 | |
| Real Estate | -3.64 | |
| Energy | -9.02 | |
| Healthcare | -11.71 |
Summary
✅ Over the evaluated periods, U.S. sector performance reveals distinct trends and investment opportunities. Technology remains a powerhouse, consistently outperforming across timeframes. Defensive sectors like Utilities have proven resilient amidst volatility, offering stability for risk-averse investors. However, significant headwinds persist in Healthcare and Energy, emphasizing the need for strategic diversification. Investors are advised to balance cyclical enthusiasm with defensive prudence to navigate the evolving market landscape effectively.
Smart Data Insight
Master the Perfect Entry & Exit for this Stock
Don't leave your profits to chance. Historically, this stock follows specific seasonal patterns that institutional traders use to maximize returns.
- ✅ Identify the "Golden Buying Window"
- ✅ Avoid high-risk correction cycles
- ✅ Backtested data from the last 20+ years