January 29, 2026 a 09:31 am


U.S. Sectors - Performance Analysis
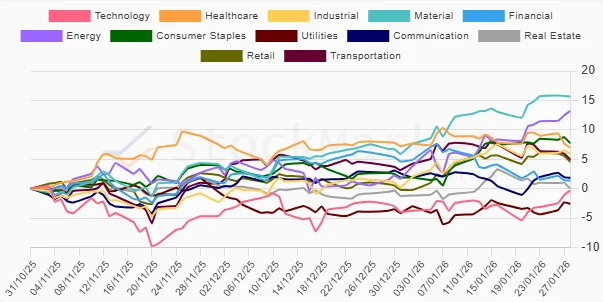
In the past quarters, we've observed significant fluctuations across U.S. sectors, influenced by varying economic conditions and market sentiments. Notably, Energy and Material have consistently emerged as top performers, whereas sectors like Healthcare and Financial have shown vulnerability in specific periods. It's crucial to analyze these patterns to strategically align portfolios with evolving market dynamics.
U.S. Sectors Performance One Week 🗓️
| Sector | Performance (%) | Performance |
|---|---|---|
| Technology | 2.97% | |
| Energy | 2.31% | |
| Utilities | 1.46% | |
| Material | 0.87% | |
| Communication | 0.43% | |
| Consumer Staples | 0.07% | |
| Real Estate | -0.70% | |
| Industrial | -0.82% | |
| Retail | -0.84% | |
| Financial | -1.53% | |
| Transportation | -2.48% | |
| Healthcare | -2.53% |
U.S. Sectors Performance One Month 🗓️
| Sector | Performance (%) | Performance |
|---|---|---|
| Energy | 10.95% | |
| Material | 8.96% | |
| Consumer Staples | 5.26% | |
| Industrial | 4.93% | |
| Retail | 4.08% | |
| Transportation | 1.26% | |
| Utilities | 0.96% | |
| Real Estate | 0.37% | |
| Technology | 2.69% | |
| Healthcare | -0.82% | |
| Communication | -1.27% | |
| Financial | -3.96% |
U.S. Sectors Performance Three Months 🗓️
| Sector | Performance (%) | Performance |
|---|---|---|
| Material | 15.68% | |
| Energy | 13.20% | |
| Consumer Staples | 7.75% | |
| Healthcare | 6.97% | |
| Industrial | 5.93% | |
| Transportation | 4.97% | |
| Retail | 4.58% | |
| Communication | 1.81% | |
| Financial | 1.39% | |
| Real Estate | 0.04% | |
| Technology | -0.31% | |
| Utilities | -2.57% |
Summary 💡
Across the analyzed time frames, Energy and Material sectors have consistently exhibited strong performance, reflecting global economic demands and market resilience. Defensive sectors such as Consumer Staples and Healthcare showed mixed results, indicating sensitivity to broader economic indicators. Investors should consider maintaining a balanced portfolio with strategic exposure to high-performing sectors while being cautious about sectors with volatile performance. A diversified approach, considering both cyclical and defensive sectors, appears prudent in navigating uncertainties.
Smart Data Insight
Master the Perfect Entry & Exit for this Stock
Don't leave your profits to chance. Historically, this stock follows specific seasonal patterns that institutional traders use to maximize returns.
- ✅ Identify the "Golden Buying Window"
- ✅ Avoid high-risk correction cycles
- ✅ Backtested data from the last 20+ years