
May 28, 2026 a 09:32 am

U.S. Sectors - Performance Analysis
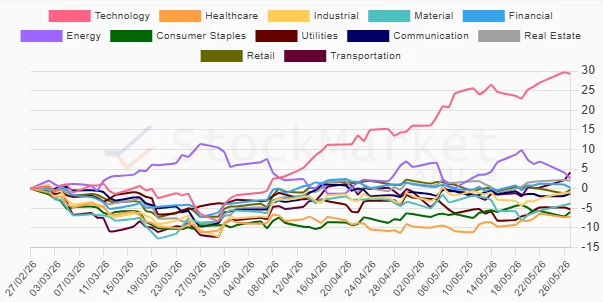
The U.S. sector performance overview indicates distinct trends across different time frames. In the short-term, Transportation and Technology lead, while Energy faces challenges. Over the one-month horizon, Technology exhibits strong momentum, contrasting with Energy and Utilities downturn. Over three months, Technology maintains impressive growth, whereas Healthcare struggles, reflecting underlying market dynamics.
📊 U.S. Sectors Performance One Week
In the past week, Transportation emerged as the top performer with a substantial rise, followed by Technology, highlighting a surge in cyclical sectors. Energy faced notable declines, indicating a retreat in this sector. Defensively, Healthcare held stable while Consumer Staples showed marginal losses.
| Sector | Performance (%) | Performance |
|---|---|---|
| Transportation | 3.94 | |
| Technology | 3.25 | |
| Material | 2.30 | |
| Industrial | 2.20 | |
| Healthcare | 0.44 | |
| Utilities | 0.32 | |
| Real Estate | 0.29 | |
| Communication | 0.14 | |
| Consumer Staples | -0.07 | |
| Retail | -0.39 | |
| Financial | -0.59 | |
| Energy | -3.64 |
📊 U.S. Sectors Performance One Month
Over the month, Technology significantly outperformed other sectors, showcasing strong investor confidence and robust demand. Cyclical sectors like Transportation also performed well. Conversely, Utilities faced downside, indicating possible shifts in defensive strategic interest.
| Sector | Performance (%) | Performance |
|---|---|---|
| Technology | 15.82 | |
| Transportation | 4.77 | |
| Healthcare | 3.46 | |
| Consumer Staples | 1.86 | |
| Real Estate | 1.68 | |
| Communication | 0.51 | |
| Industrial | 2.09 | |
| Material | -0.26 | |
| Financial | -0.77 | |
| Energy | -0.93 | |
| Retail | -1.32 | |
| Utilities | -2.31 |
📊 U.S. Sectors Performance Three Months
In the three-month view, Technology's substantial increase underscores its pivotal role in market growth. Conversely, Healthcare's fall, alongside other traditionally defensive sectors, illustrates a potential risk-off sentiment shift.
| Sector | Performance (%) | Performance |
|---|---|---|
| Technology | 29.29 | |
| Transportation | 4.09 | |
| Energy | 2.63 | |
| Real Estate | 2.01 | |
| Financial | 0.22 | |
| Retail | -0.32 | |
| Industrial | -1.08 | |
| Communication | -1.26 | |
| Utilities | -5.27 | |
| Consumer Staples | -5.96 | |
| Material | -3.85 | |
| Healthcare | -7.14 |
✅ Summary
The sectoral analysis reveals Technology's robust outperformance across all time frames, pointing towards its strategic importance. Cyclical sectors like Transportation also benefited from market dynamics, highlighting potential opportunities. In contrast, Energy and Utilities demonstrated vulnerability, indicating potential risks in defensive investment approaches. Overall, the analysis underscores the importance of strategic diversification and vigilance in sectoral shifts.
Smart Data Insight
Master the Perfect Entry & Exit for this Stock
Don't leave your profits to chance. Historically, this stock follows specific seasonal patterns that institutional traders use to maximize returns.
- ✅ Identify the "Golden Buying Window"
- ✅ Avoid high-risk correction cycles
- ✅ Backtested data from the last 20+ years